
- Tesla is testing a strong support level at $347 and could either bounce or drop further.
- Traders are watching Fibonacci and Ichimoku signals to predict Tesla’s next move.
- If the support fails, Tesla may slide toward $295 but a rebound could push it above $378.
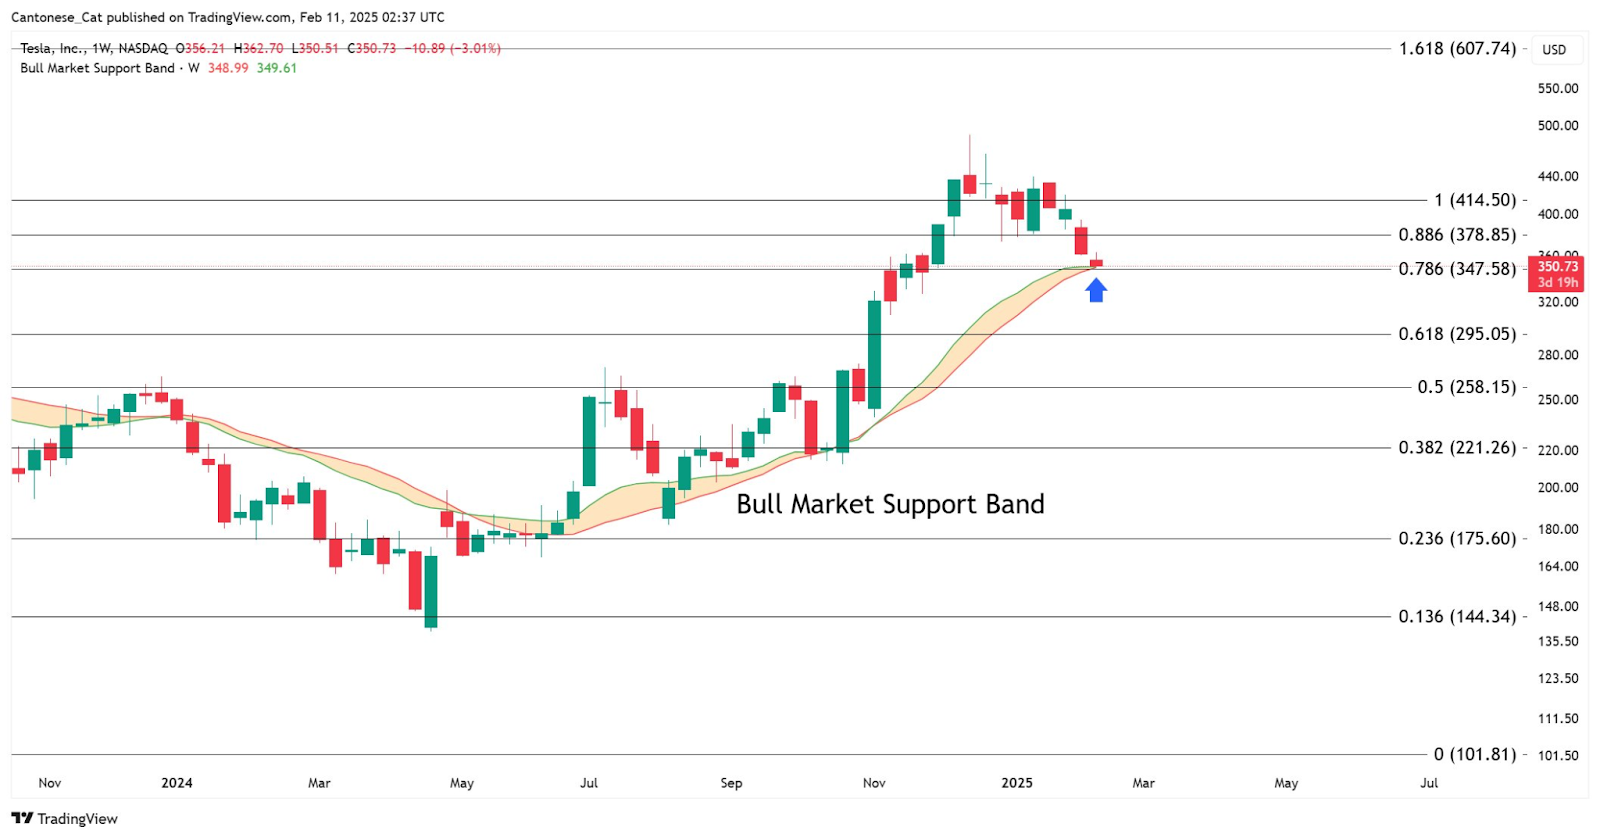
Tesla Inc. (TSLA) has reached a decisive point in its price structure, trading at $350.73, down 3.01% (-10.89) on the week. Notably, the stock is now testing the Bull Market Support Band, a widely followed indicator that often determines bullish or bearish trends. Market analyst Cantonese_Cat had anticipated this level for weeks, purchasing at $347-$350, aligning with the 0.786 Fibonacci retracement at $347.58.
Additionally, a secondary confirmation comes from Tesla’s two-week Ichimoku Tenkan-Sen level, reinforcing this as a potential make-or-break support. The coming sessions will likely decide whether Tesla stabilizes or enters a deeper correction toward lower Fibonacci levels.
Fibonacci Levels and Key Technical Confluence Define Tesla’s Price Action
Tesla’s retracement follows a structured pullback from its recent peak near $414.50 (1.0 Fibonacci level), with the stock now sitting between key technical zones. The 0.886 retracement at $378.85 previously acted as resistance, while the 0.618 level at $295.05 remains a lower support target if the current level fails. The Bull Market Support Band, spanning $348.99-$349.61, aligns almost perfectly with the Ichimoku Tenkan-Sen at $350.32, adding to the significance of this price zone.
A break below this level could accelerate downside momentum, targeting $258.15 (0.5 Fibonacci retracement) or even $221.26 (0.382 level). Conversely, if buyers defend this region, Tesla could stage a reversal toward $378 and $414, reclaiming bullish momentum.
Ichimoku Cloud and Trend Structure Indicate a Critical Crossroads
The second chart introduces the Ichimoku Cloud, adding further depth to Tesla’s technical outlook. The Tenkan-Sen (blue line) at $350.32 has acted as dynamic support over the past sessions. Historically, price movements that test the Tenkan-Sen often decide short-term trends. A clean bounce could push Tesla back toward higher Fibonacci levels, but a confirmed break below the cloud zone would expose the stock to a deeper decline.
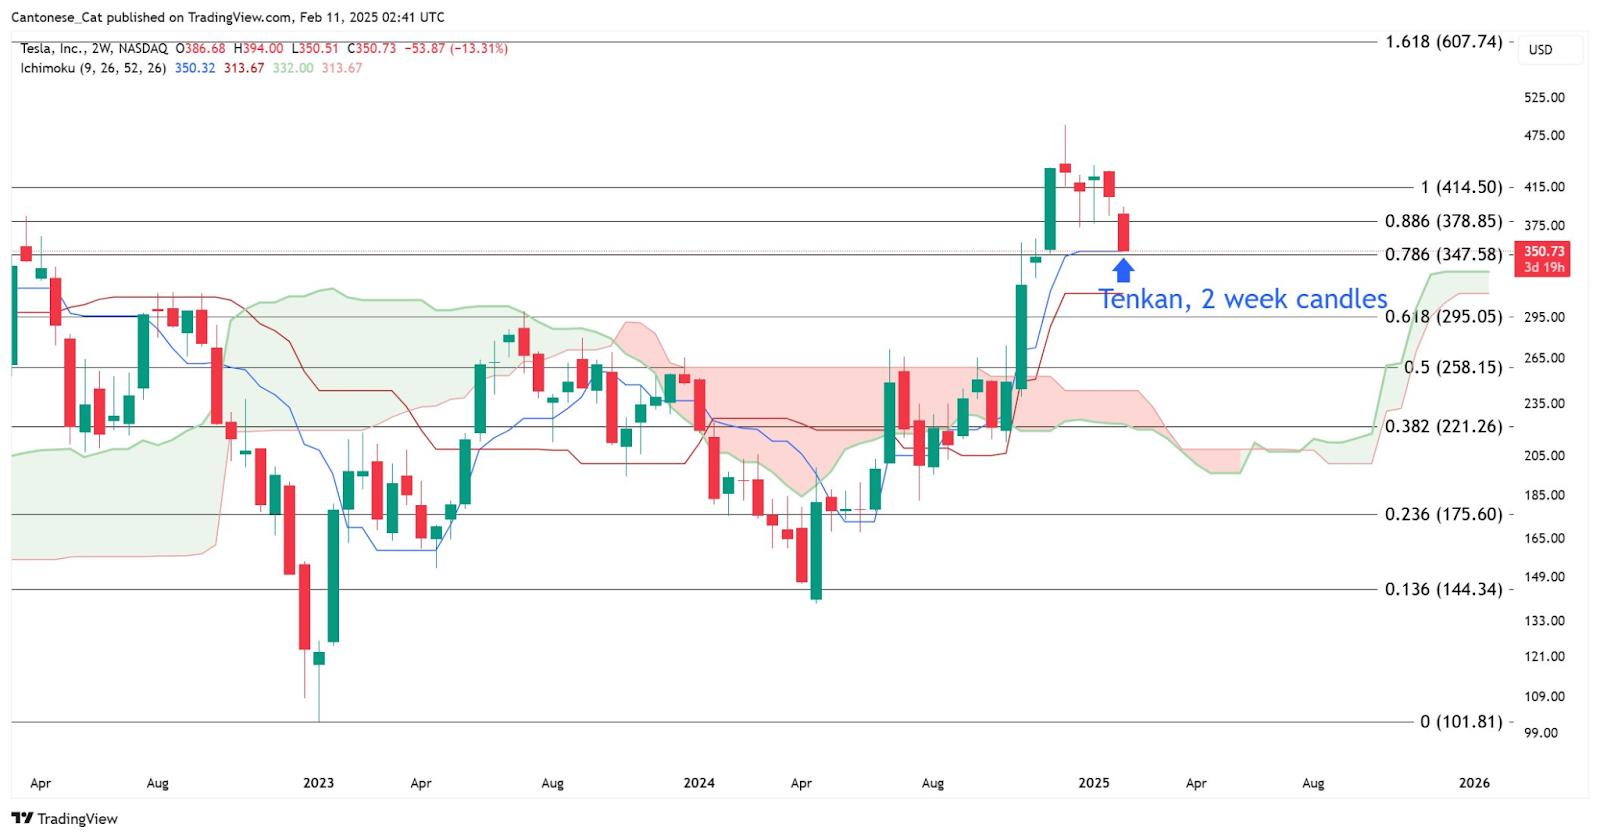
Looking at the broader trend, Tesla had experienced a strong uptrend from mid-2024, but the latest red candles indicate growing selling pressure. If the price breaks into the Ichimoku cloud, it could signal trend weakening, whereas holding above Tenkan-Sen would suggest continued bullish structure.
Market Sentiment and Outlook: Rebound or Breakdown?
Tesla’s latest decline has stirred debate among investors. Analyst Cantonese_Cat, despite acknowledging the potential for lower levels, remains cautiously optimistic about the $347-$350 accumulation zone. The mixed sentiment reflects the broader market uncertainty, with bulls hoping for a reversal while bears eye further downside.
If Tesla holds this region, an upward push toward $378-$414 could materialize in the coming weeks. However, a failure at $347 would likely expose $295 and $258, potentially resetting the bullish narrative. With both Fibonacci and Ichimoku levels converging, Tesla now stands at a pivotal moment—either a strong bounce or an extended downturn.