
- TD Sequential signals a possible reversal as WIF/USDT faces strong bearish momentum, dropping 24.57% in a week.
- Heavy selling pressure persists, with a 2.57B volume spike and price struggling below key resistance at $1.3488.
- Buyers defend $0.65, but WIF/USDT remains in a downtrend, with a potential drop to $0.55 if selling pressure continues.
The WIF/USDT perpetual contract has exhibited sharp price swings, showing bearish pressure in recent weeks. The latest data reveals a steep 24.57% weekly decline, with the price opening at $0.9492, peaking at $0.9498, and plunging to a low of $0.6329 before closing at $0.7159. Additionally, the TD Sequential indicator has flashed a buy signal on the weekly chart, suggesting potential trend exhaustion.
Market Downtrend and TD Sequential Signal
The data shows a continuous downward trend, with the price consistently forming lower highs and lower lows. A red “9” signal has appeared on the latest candlestick, aligning with a potential reversal. Previously, the same signal appeared at a market peak, which led to a significant price decline.
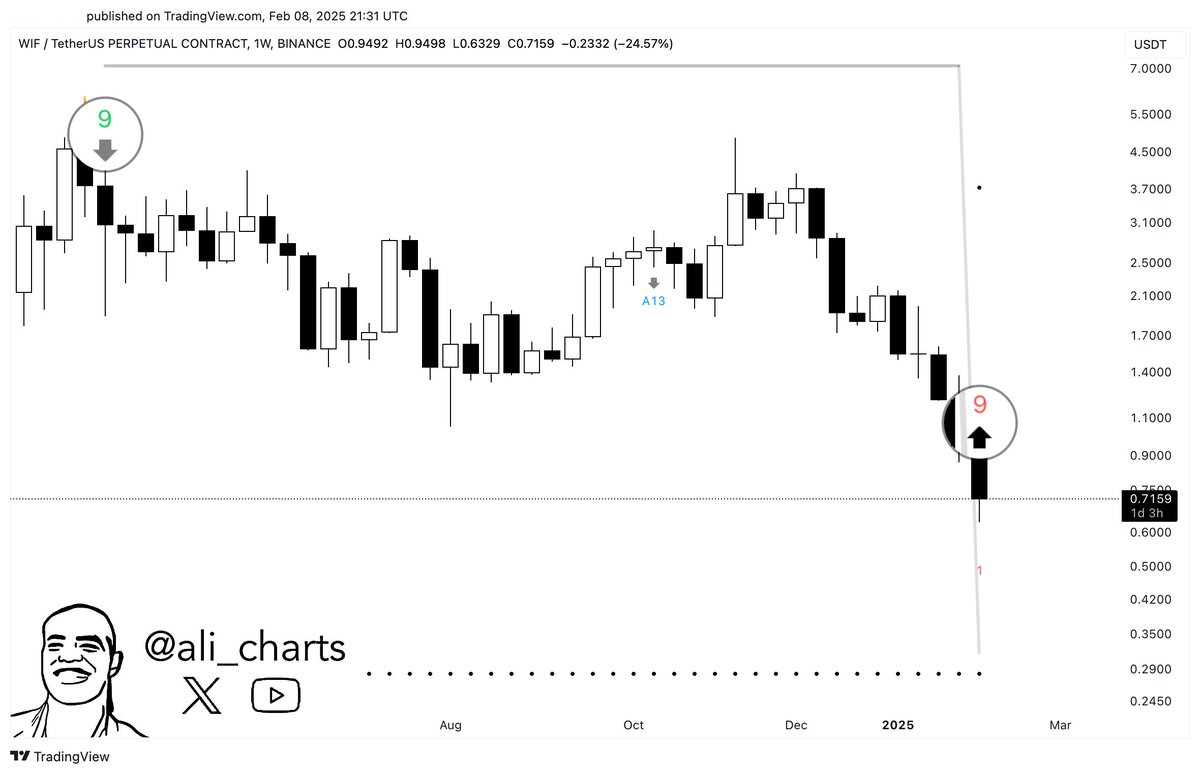
Moreover, the presence of a long lower wick in the latest candle suggests strong buying interest near the lowest levels. Buyers stepped in aggressively when the price fell below $0.65, pushing it back up before the weekly close. This indicates increased activity around a key support zone. However, bearish sentiment remains dominant.
Volume and Key Levels Indicating Bearish Momentum
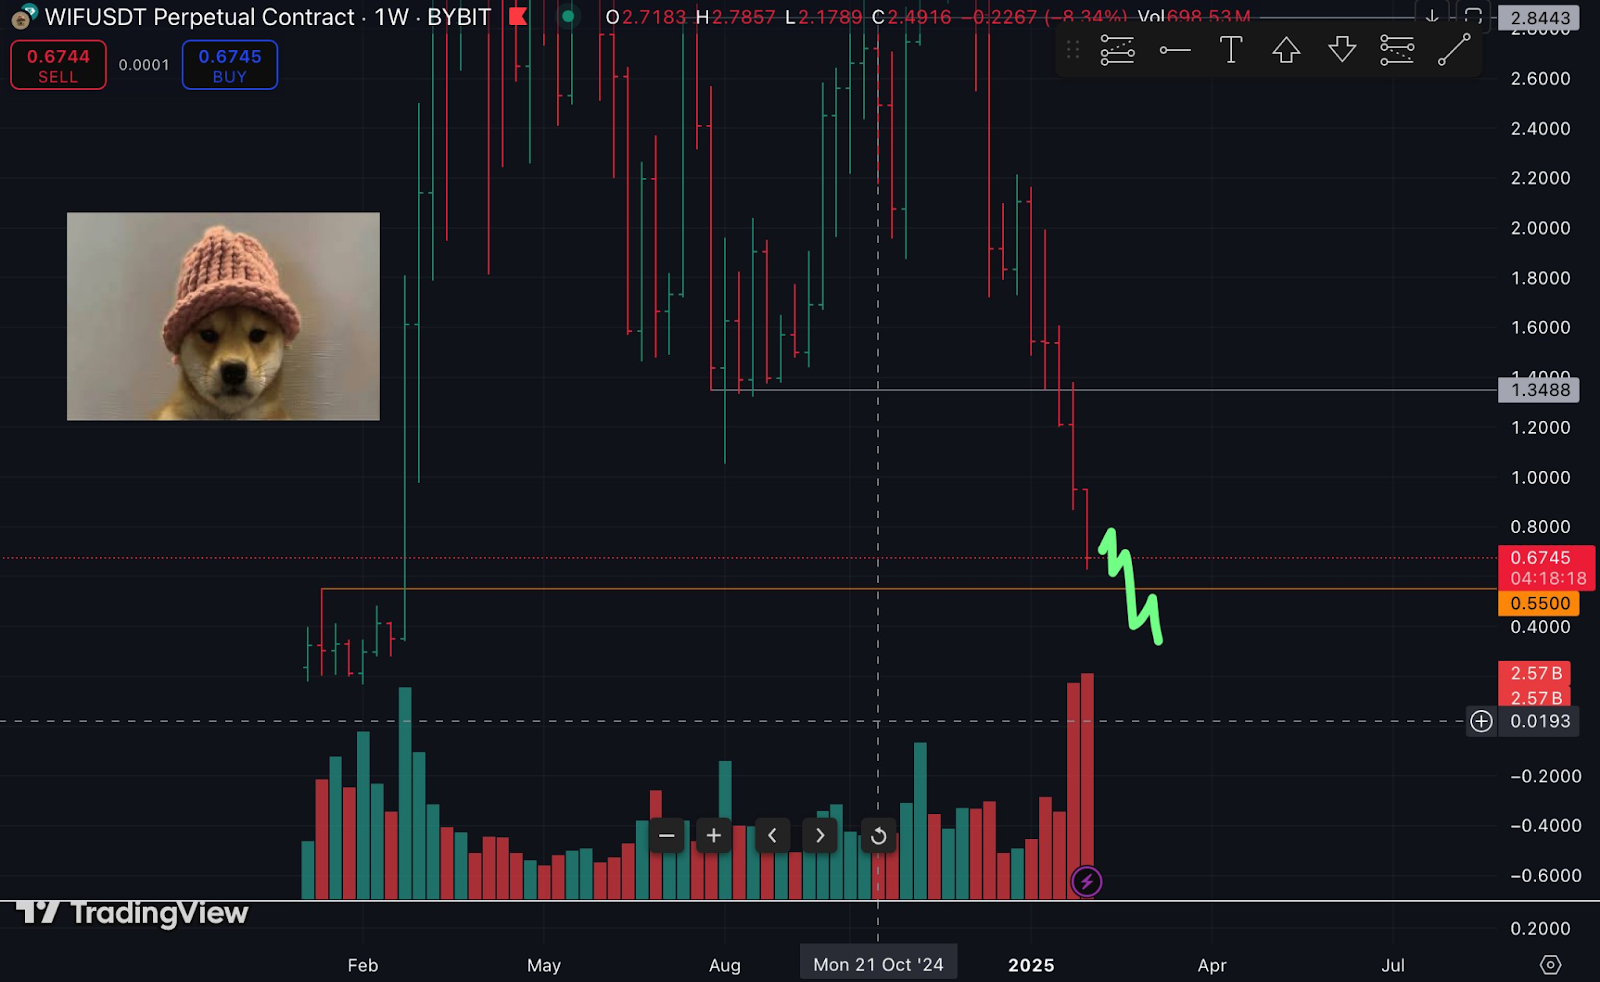
Volume analysis reveals intensified selling pressure, with a massive 2.57 billion volume spike recorded. This surge in sell-side participation reflects strong market activity. Furthermore, the price recently broke below the $1.3488 level, confirming the continuation of bearish momentum.
In addition, a diagonal trendline in the chart signifies a strong downward trajectory. The price action remains below this trendline, reinforcing the ongoing bearish sentiment. A green zigzag projection on the chart suggests a further drop, with key support around $0.5500, which may serve as the next crucial level to watch.
Historical Price Action and Future Outlook
Previously, WIF/USDT experienced a strong rally above $2.8000 before facing a steep reversal. The sustained selling pressure has prevented any bullish correction. Consequently, the recent price action continues to reflect extreme volatility, with large intraday fluctuations.
Besides, technical indicators suggest potential price stabilization if buying interest sustains near key support levels. However, further downside remains a possibility if sellers continue to dominate. Traders should monitor volume dynamics and price reactions at support zones for potential trend shifts.