- SUI forms an ascending triangle, with resistance at $4.30 and a bullish target near $10.
- RSI at 44.05 shows neutral to bearish momentum, while MACD convergence hints at a possible momentum change.
- Support is at $3.00, with downside risks toward $2.80 if the trendline fails to hold current levels.
SUI is showing a bullish technical structure on the weekly timeframe, with price movement consolidating below a major resistance level. The token trades at $3.31 after slipping 2.26% in the past day.
Its session range was between $3.302 and $3.4, a steady decline from the August high of $4.30. According to analyst CryptoBullet, SUI has now bounced from support for the third time, printing what he describes as a textbook ascending triangle.
Resistance at $4.30 Shapes Ascending Triangle
The chart shows horizontal resistance at $4.30, a level repeatedly rejected despite rising higher lows. A black ascending trendline marks this climb, supported by blue arrows showing increasing buying pressure.
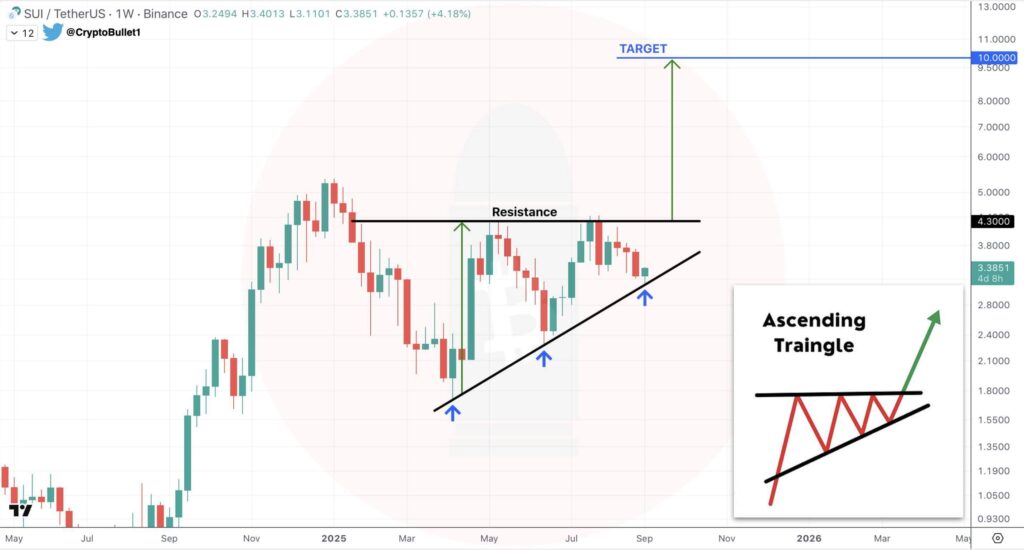
Such a formation generally shows growing demand beneath a static ceiling. The projection from the triangle base, extending from $2.30 to $4.30, sets a bullish target near $10. This target is illustrated in the chart with a labeled green arrow.
Indicators Point to Neutral but Fragile Momentum
While the long term setup looks constructive, shorter term indicators remain fragile. The RSI is at 44.05, below the midpoint of 50, with its signal line at 45.12.
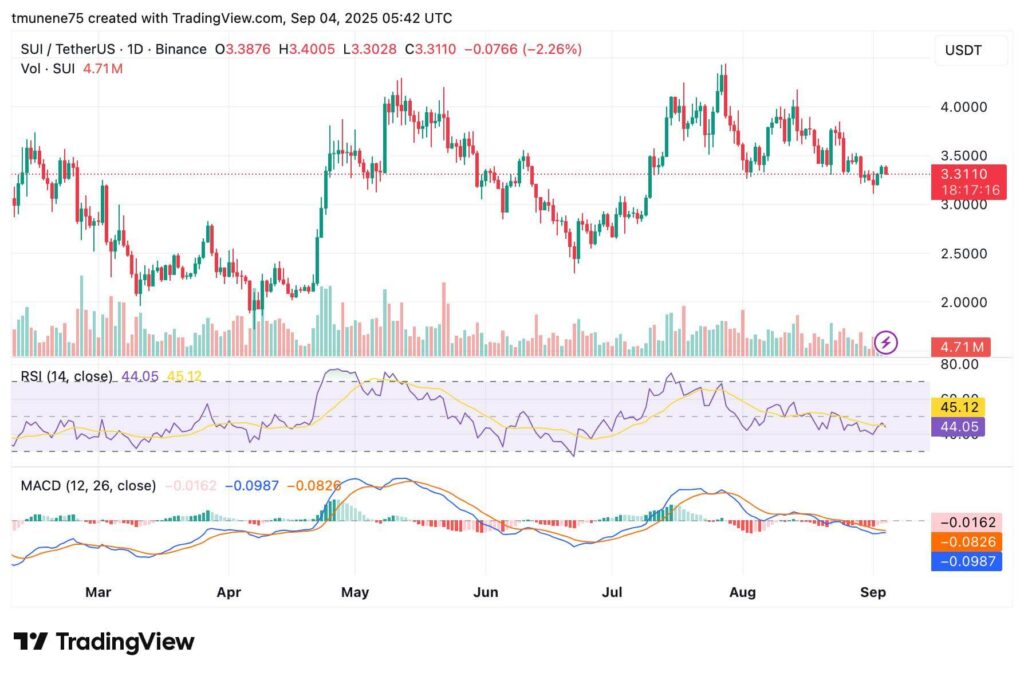
This position shows sellers retaining a slight advantage, though without pushing the market into oversold conditions. If RSI slips under 40, further downside pressure could follow, yet a move above 50 would strengthen the bullish case.
Momentum confirms the same cautious stance. The MACD line reads -0.0987 compared to a signal line of -0.0826. The histogram is also negative at -0.0161. This structure shows ongoing bearish weight but with lines converging, suggesting a potential change if buying volume increases.
Support and Downside Risk Levels
Despite optimism around the ascending triangle, SUI faces immediate technical hurdles. Price struggles at $3.50–$3.80, with the $3.00 level acting as firm support. A decisive break above resistance could lead back to $4.20–$4.30 highs.
However, losing the $3.00 risks another test of the $2.80 area. Analyst CryptoBullet maintains a $10 target on a successful breakout, but failure to defend support would challenge the pattern’s validity.