
- SUI lost the $0.80 support level, shifting attention toward the $0.55-$0.65 accumulation area and nearby demand.
- Price traded near $0.7034 after a 6% decline, while sellers maintained control across short-term market structure.
- Long-term projections point higher, though support stability remains the primary focus for market participants.
SUI Support Zone remains a central focus after recent weakness. Market participants are watching lower support levels closely. Traders continue assessing downside risks alongside longer-term recovery expectations.
SUI Loses Critical Support as Selling Persists
A recent market update from analyst SuiInsiders noted the loss of support near $0.80. That level previously acted as a key defensive area. Its breakdown altered the near-term technical outlook.
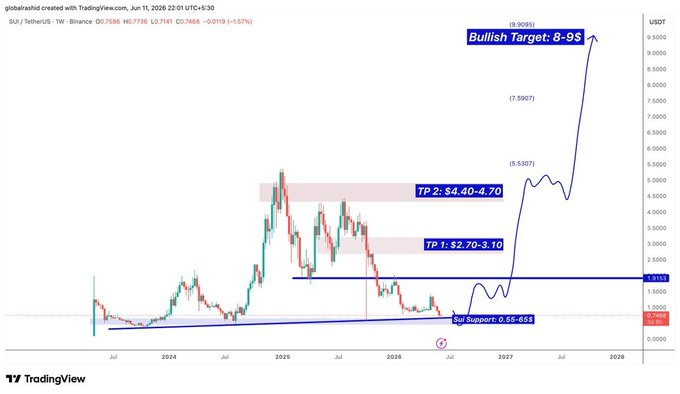
The chart shared on social media outlined fresh downside targets. Attention shifted toward the $0.55-$0.65 region afterward. This area now represents the next major demand zone.
Analysts noted that increased volatility could pressure prices further. Under that scenario, a temporary move toward $0.50 remains possible. Such a movement would fit historical cryptocurrency correction patterns.
Even so, the projected decline does not indicate structural collapse. Instead, the roadmap presents a continuation of corrective activity. Traders continue evaluating support behavior before determining direction.
Short-Term Chart Reflects Weak Market Structure
The latest 24-hour chart showed SUI trading around $0.7034. The token declined more than six percent during the session. Selling pressure remained evident throughout most trading hours.
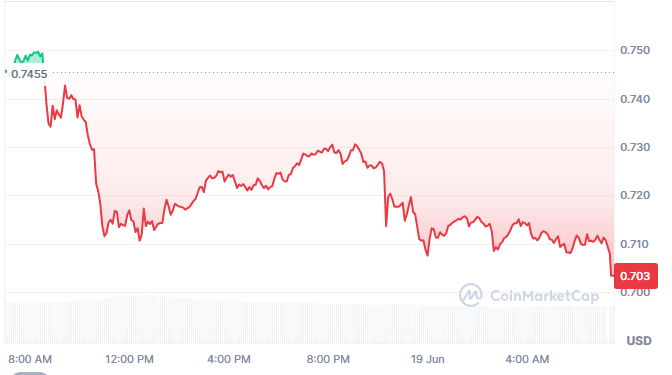
Price started near $0.745 before encountering aggressive resistance. Sellers quickly forced a move below the $0.720 region. That decline established a bearish tone for the session.
Several recovery attempts emerged during intraday trading activity. However, rallies repeatedly stalled near resistance levels. Buyers failed to establish a stronger upward structure.
Lower highs continued forming across the chart afterward. Market participants appeared willing to sell strength repeatedly. As a result, bearish momentum remained firmly intact.
Accumulation Scenario Emerges on Long-Term Projection
The same roadmap also outlined a broader market perspective. According to the projection, consolidation could continue for months. Price may establish a lengthy accumulation phase.
An ascending trendline remains visible beneath current trading levels. The chart suggests this support remains technically relevant. Long-term participants continue monitoring its performance carefully.
If demand returns, the first recovery objective sits higher. The projected target range extends from $2.70-$3.10. That zone corresponds with historical trading activity.
A second target appears between $4.40 and $4.70. Beyond that, the roadmap identifies an $8-$9 objective. For now, attention remains fixed on the SUI Support Zone and its ability to hold.