
- SUI trades at $3.45 with bullish pennant formation signaling potential continuation above resistance.
- Institutional demand grows as 100M tokens added to treasury, supporting weekly 13% price gain.
- Key levels stand at $3.62, $3.85, and $4.44, with support near $3.11 aligning with Bollinger Band.
SUI is trading at $3.45, maintaining strength after forming a bullish pennant pattern on the weekly chart. The structure suggests upwards continuation is likely if resistance levels are surpassed. With institutional demand supporting recent price action, the market is watching closely for a confirmed breakout in coming sessions.
SUI Price Holds Bullish Pennant Formation
The weekly chart recorded SUI at $3.3968 after gaining 4.54 percent, with price closing above $3.39 and reaching $3.4562 intraday. The pattern formed between resistance near $6.00 and ascending support from $2.20, compressing price action within converging trendlines. According to Redoshi Endomoto, the bullish pennant setup favors continuation higher.
Price history showed consistent higher lows, with consolidation holding above the $3.00 level. Volume activity remained steady, aligning with technical expectations during formation stages. The RSI stood at 50.85, while the divergence reading marked 52.49, both reflecting neutral conditions before potential breakout confirmation.
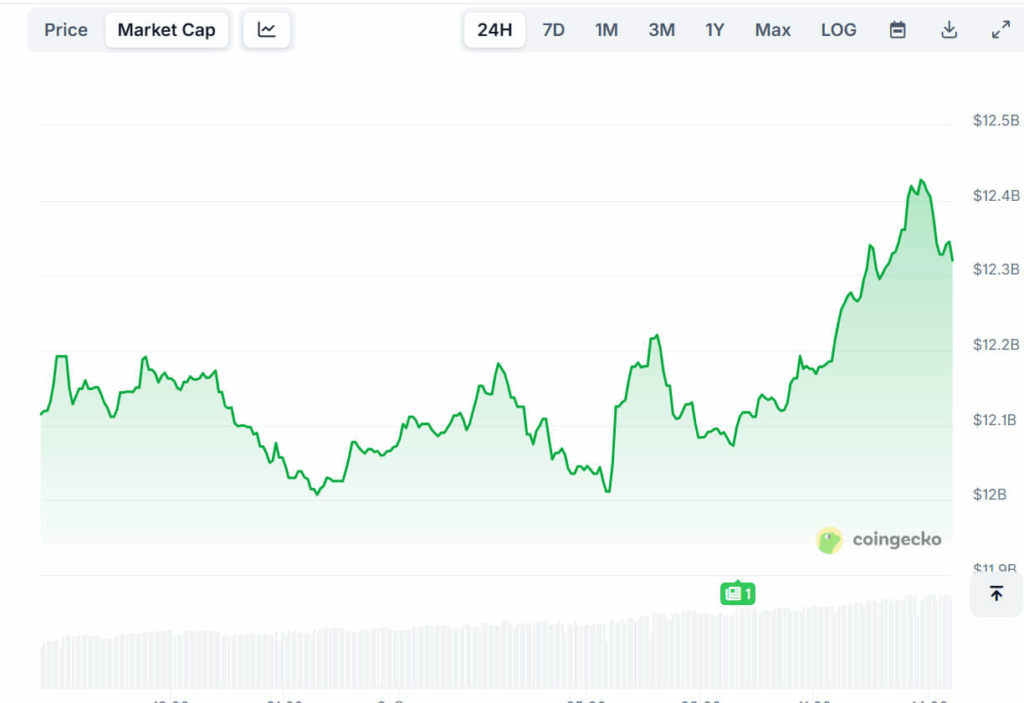
Data from CoinGecko placed market capitalization above $12.3 billion, supported by circulating supply of 3.56 billion tokens. Trading activity exceeded $822 million in 24 hours, maintaining liquidity across major exchanges. The structure suggests that momentum may strengthen once resistance levels are challenged.
Institutional Support and Key Levels
On September 2, SUI Group Holdings Limited confirmed the accumulation of over 100 million SUI tokens in its treasury. This development provided strong fundamental backing, with the token gaining 13 percent during the week. According to an analysis prepared by BitGuru, SUI has been recovering after forming a major low near $3.20.
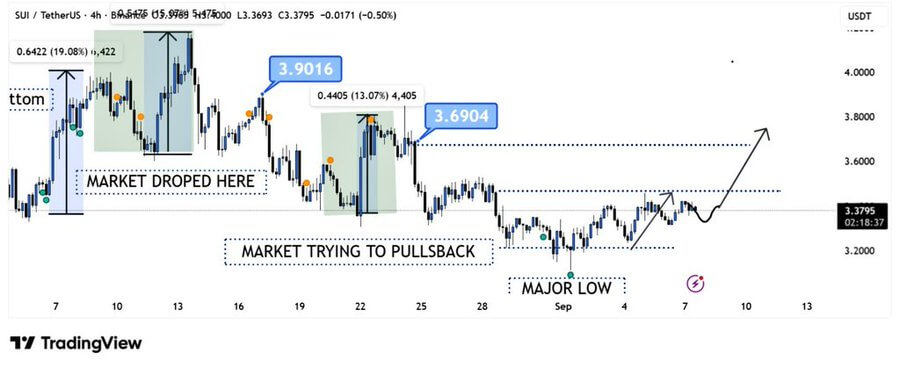
Technical analysis showed price breaking above the 7-day SMA at $3.36, now testing the 20-day SMA at $3.42. The next hurdle stands at the 50-day SMA of $3.62, with resistance levels observed at $3.85 and $4.44. Support remains firm near $3.11, which aligns with the lower Bollinger Band.
If price holds above $3.35, momentum could extend toward the $3.60–$3.80 range. Analysts note that a breakout above $3.85 may open paths toward $4.00. With institutional demand building and technical patterns favoring upward continuation, SUI remains positioned for further strength.