
- SUI holds long-term channel support that previously triggered a 1,060% cycle rally.
- Analysts map an 860% projection toward $20 as price follows its established channel path.
- Key levels at $2.05–$2.72 guide momentum while RSI and MACD shifts shape short-term direction.
SUI trades near the lower boundary of its long-term ascending channel, and the level matches the same area that produced a 1,060% rally during the last major cycle. The market now holds this zone again, and the current structure shows an 860% path toward the $20 region if price action repeats earlier behavior. At the time of writing, SUI was trading at $1.80.
Long-Term Structure and Channel Behavior
SUI continues to move inside a broad ascending channel that has remained intact since 2023, and the structure shows clear swing highs and swing lows. According to analysis prepared by Ali Charts, price touched the lower boundary near 2.1 before buyers lifted it back into the channel and restored upward movement.
Candles now move toward the mid-channel region, and the chart shows steady progress through historical consolidation between $2.8 and $4.2. Calculations on the weekly chart display an 860% projection toward the $20 level, which sits near the channel’s upper boundary. The pattern aligns with earlier behavior, and the structure remains stable with price tracking the established trajectory.
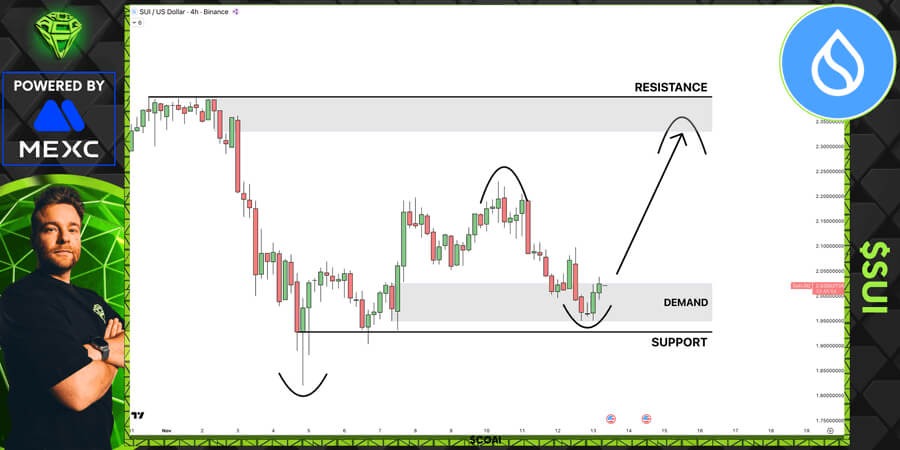
According to analysis prepared by Alt Crypto Gems, the 4-hour chart shows SUI forming two curved reactions inside a demand zone before climbing toward resistance. Price then rises from the support area and approaches the mid-range band, which controls short-term momentum.
Near-Term Levels, Indicators, and Market Structure
Analysts monitor $2.05, $2.27, and $2.72 as short-term points that shape the next move, and the $2.40 region forms the first major bullish target. This target aligns with previous structural levels and also matches the upper band of the recent analyst consensus.
Technical conditions require RSI to move above 40 and MACD to shift positive, and analysts note that these signals remain reachable within one to two weeks. Risk levels form at $1.76 and $1.71, which mark key support points for the short-term outlook.
A breakdown below these levels may shift momentum toward deeper support zones. Analysts continue to monitor the long-term channel because the last reaction from this boundary produced the 1,060% rally, and current projections map an 860% move toward $20 if market behavior aligns with previous patterns.