- SUI forms an ascending triangle near $2.75, showing strong accumulation and steady demand.
- Trading volume and market capitalization rise, confirming active participation and sustained buying pressure.
- Derivatives data show balanced sentiment with increased volume, supporting potential breakout above $2.75.
SUI is forming an ascending triangle pattern, showing strong accumulation near resistance. If price breaks out and retests $2.75 successfully, it could target the $3 zone next, marking a potential continuation of bullish momentum. Market structure and trading data indicate consistent accumulation and growing participation across both spot and derivatives markets.
SUI Maintains Upward Structure with Steady Market Activity
The SUI chart shows a clear ascending triangle pattern, with higher lows forming against a resistance level near $2.75. Price remains above $2.60, confirming a steady upward trajectory supported by active trading. According to an analysis by Crypto Pulse, “SUI is forming an ascending triangle pattern, showing strong accumulation near resistance.”
The pattern indicates consistent compression within the structure, reflecting controlled volatility and sustained demand. TradingView data recorded that SUI has been forming a stable base since mid-October, with buyers maintaining control near the trendline support.
The price traded within a tight range of $2.57 to $2.70 before closing near $2.60. Despite minor pullbacks, daily trading volume rose by 31.25% to $919.4 million, showing active participation. The market capitalization stood at $9.42 billion, while the fully diluted valuation reached $26 billion, reflecting steady capitalization.
Derivatives Data Confirms Continued Participation and Balanced Sentiment
According to Coinglass, SUI derivatives activity recorded a 40.97% increase in volume to $1.95 billion, while open interest slightly declined by 2.51% to $875.81 million. The 24-hour long to short ratio was 0.9814, and there was an equal buyer sentiment and seller sentiment.
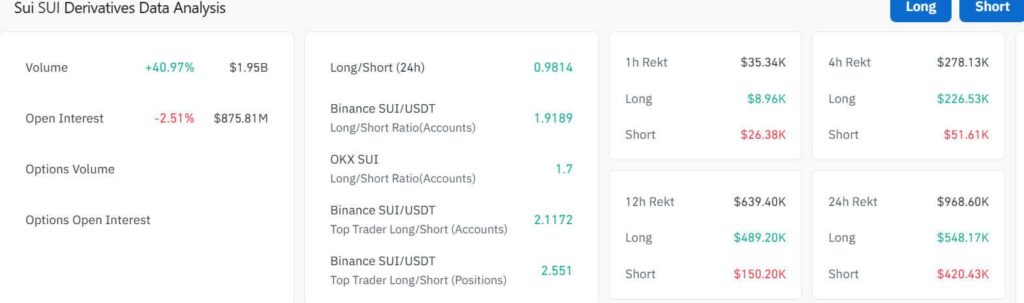
On Binance, the long-to-short ratio reached 1.9189 by accounts, while OKX reported 1.7, indicating stronger long positioning among traders. Liquidation data included total 24-hour liquidations of $968.60K, of which $548.17K were long positions and $420.43K short positions.
These figures reflected stable trading activity with controlled risk across major exchanges. The combination of growing spot activity, rising derivatives volume, and consistent accumulation near resistance positions SUI for potential upward continuation if the price confirms a breakout and successful retest above $2.75.