
- SUI trades near $0.7853 as immediate resistance at $0.793-$0.800 comes into focus after its rebound from $0.710-$0.715.
- CryptoBullet sees a potential breakout from SUI’s 500-day falling wedge, while Ali Charts identifies a daily TD Sequential buy signal.
- Michael van de Poppe watches $0.7330 as a key trigger, with a potential move toward $0.87-$0.90 if momentum strengthens.
SUI is nearing the $0.80 mark after recovering from early September lows, while analysts point to possible upside moves. CryptoBullet sees a 500-day falling wedge on the weekly chart. Ali Charts cites a daily TD Sequential buy signal. Michael van de Poppe watches $0.7330. The latest market data shows SUI around $0.7853, with $0.793–$0.800 acting as immediate resistance.
Weekly Pattern
According to analyst CryptoBullet, SUI appears ready to break from a giant 500-day falling wedge. His view comes from the weekly line chart, where the long pattern remains the focus. The analyst also asked SUI holders whether they were ready for a breakout.
That setup comes as SUI recently recovered from lower levels. Price rebounded from roughly $0.710–$0.715 on Sept. 2 before moving toward the $0.790–$0.800 resistance area. Meanwhile, Ali Charts focused on SUI’s daily chart and the TD Sequential indicator.
According to Ali Charts, the indicator is flashing a buy signal after the recent correction. The signal points to a possible one-to-four daily candlestick rebound. It could also represent the start of a new bullish countdown, according to the analyst.
Short-Term Levels Keep $0.80 in Focus
Michael van de Poppe linked SUI’s potential move to Bitcoin breaking higher. He said a move above $0.7330 would trigger the next move, with $0.87–$0.90 as the next target. Van de Poppe also said the BTC pair could break out, with the trend reaching $1.50. However, the latest price data places SUI below the immediate $0.793–$0.800 barrier.
SUI traded around $0.7853 at the captured time. The latest hourly candle opened at $0.7934, reached $0.7939, fell to $0.7843, and closed at $0.7853. That represented a 1.03% hourly decline.
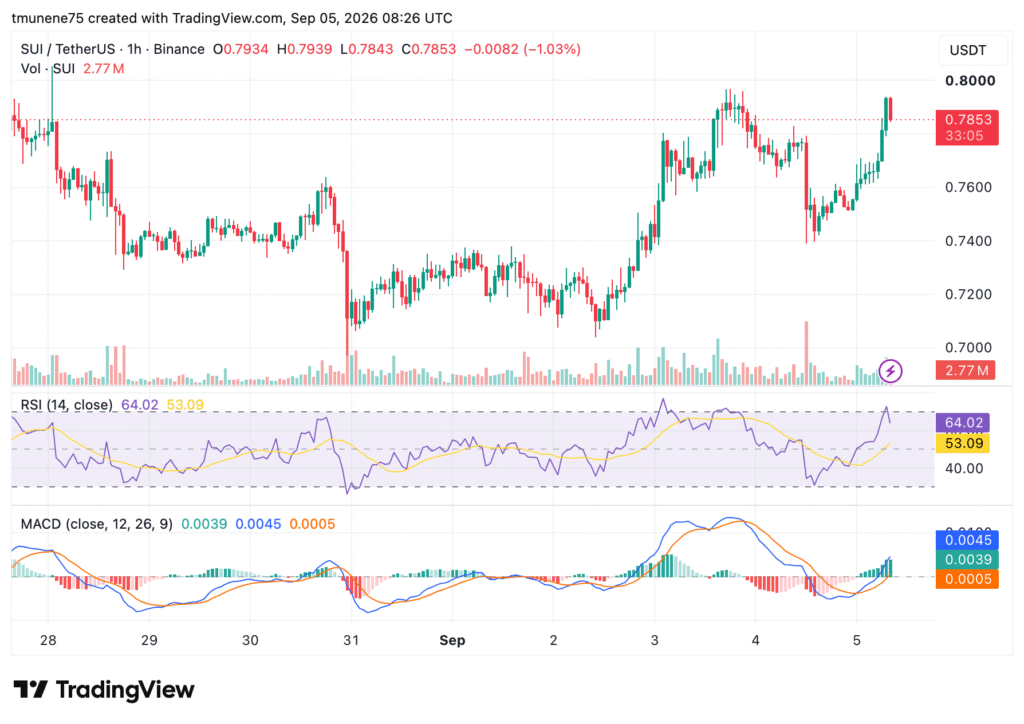
Support is around $0.760. Stronger support appears around $0.740–$0.750. RSI stood at 64.02, above its 53.09 moving average. MACD values were about 0.0039, 0.0045, and 0.0005, while volume reached roughly 2.77 million SUI.