- Solana struggles at key Fibonacci levels, with $146.89 acting as crucial support and potential downside targets near $101.74 and $78.33.
- Market structure hints at uncertainty, as an ascending wedge pattern suggests a possible breakout or breakdown in the coming sessions.
- Trendline support remains intact, but SOL must reclaim $168.78 to confirm a bullish shift and avoid extended consolidation.
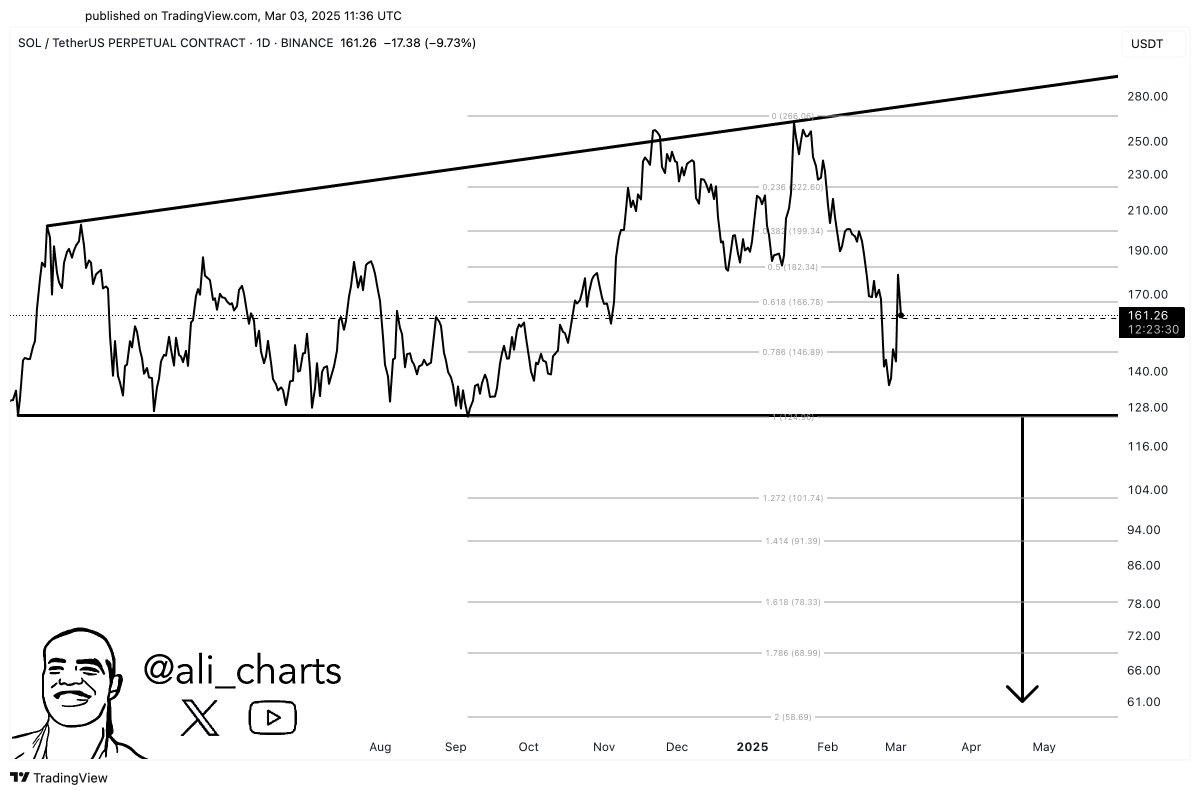
According to analyst Ali, SOL recently dropped to $161.26, a sharp 9.73% decline. A right-angled ascending broadening formation is shaping the market structure, influencing price action. Following a previous high of $266.96, the market failed to sustain momentum, leading to a downward shift.
Solana Approaching Key Fibonacci Levels
The price recently broke below the 0.618 Fibonacci retracement at $168.78 but showed signs of a minor rebound. If selling pressure persists, the next critical support sits near the 0.786 retracement level at $146.89.
Additionally, Fibonacci extension levels suggest potential lower targets. The 1.272 extension aligns with $101.74, while the 1.618 level points to $78.33. In an extreme downturn, the 2.0 extension projects a possible drop to $58.69. A horizontal black support line further reinforces the potential breakdown area.
Besides Fibonacci levels, the current price structure forms an ascending wedge pattern. Historically, such formations indicate a breakout or breakdown scenario. If SOL fails to hold above $146.89, traders may anticipate further losses. However, a sustained rebound above $168.78 could signal a bullish shift.
Market Sentiment and Trendline Support
Analyst Jelle shows SOL price retesting a crucial support zone while maintaining its diagonal trendline. Higher highs and higher lows indicate a bullish market structure. Additionally, technical indicators such as moving averages and the parabolic SAR suggest an ongoing uptrend.
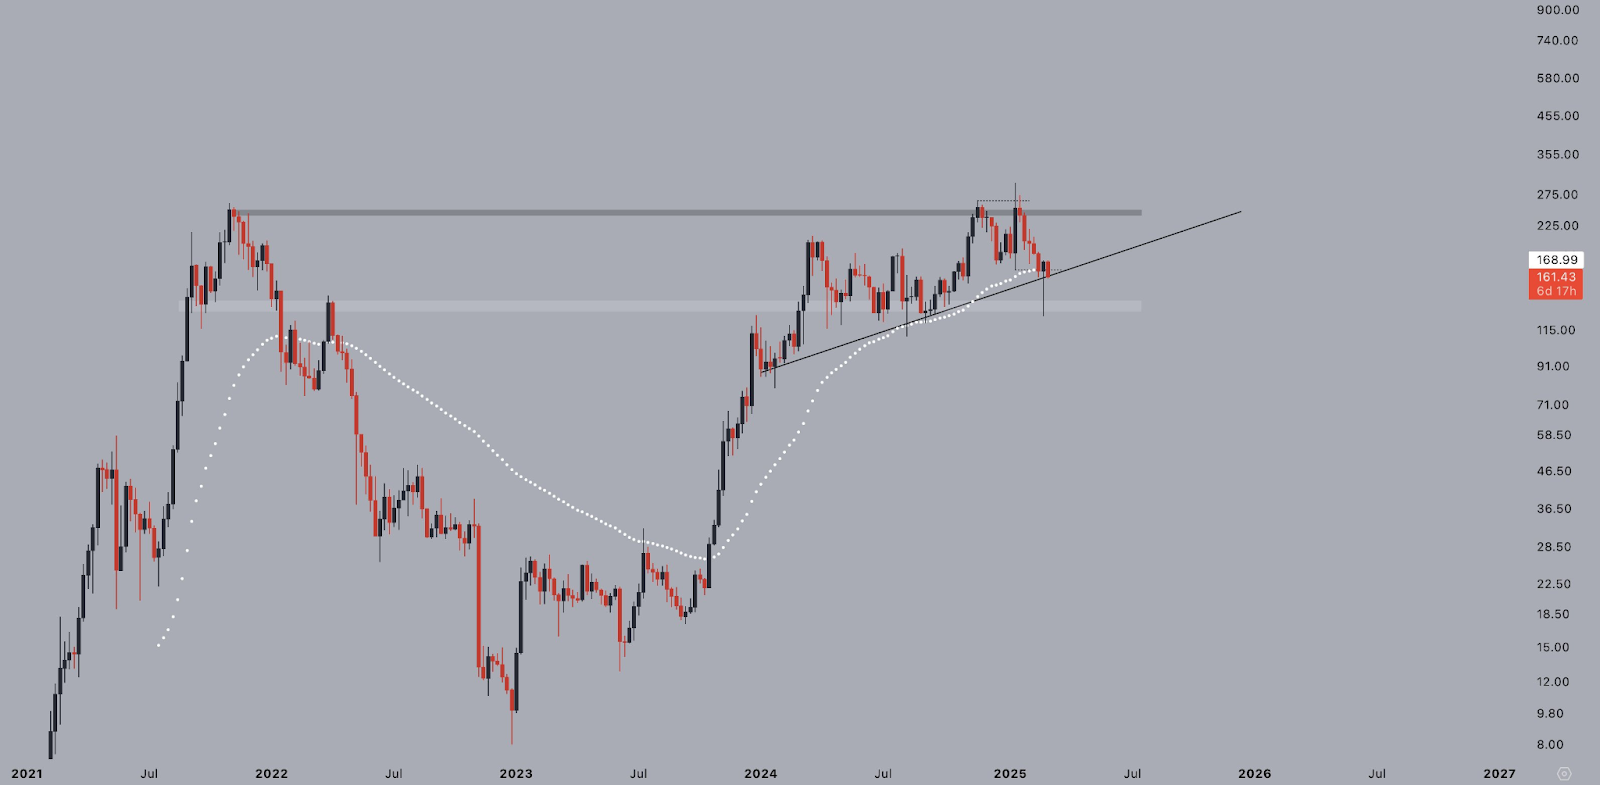
The moving average aligns with the ascending trendline, strengthening support levels. The parabolic SAR dots remained below the price during the uptrend, but recent pullbacks caused shifts above it. Despite this, the trendline remains intact.
However, price fluctuations near a horizontal resistance zone create uncertainty. A breakout above this level could push SOL into price discovery. Conversely, another rejection may lead to extended consolidation.