- Solana’s rally to $293.620 upwards is a strong move, but the RSI divergence signals a correction.
- CryptoBullet’s Elliott Wave theory analysis suggests Solana will witness a reversal, as in past market cycles.
- Fibonacci resistance at 0.618 could trigger a correction, with analysts monitoring potential drop to $40-$50.
Solana (SOL) has seen a huge price rally, moving up 20.57% to $293.620. While aggressive buying pressure has fueled the surge, analysts have identified key technical indicators that suggest a market correction is imminent.
Solana’s Historical Market Movements
According to CryptoBullet, Solana has completed a five-wave impulse move, with the recent peak marking the end of Wave (5). The market structure follows Elliott Wave Theory, indicating a potential correction phase.
A bearish divergence has formed between price action and the Relative Strength Index (RSI), signaling weakening bullish momentum. The downward trend in RSI despite new price highs suggests reduced buying pressure, reinforcing the possibility of a market downturn.
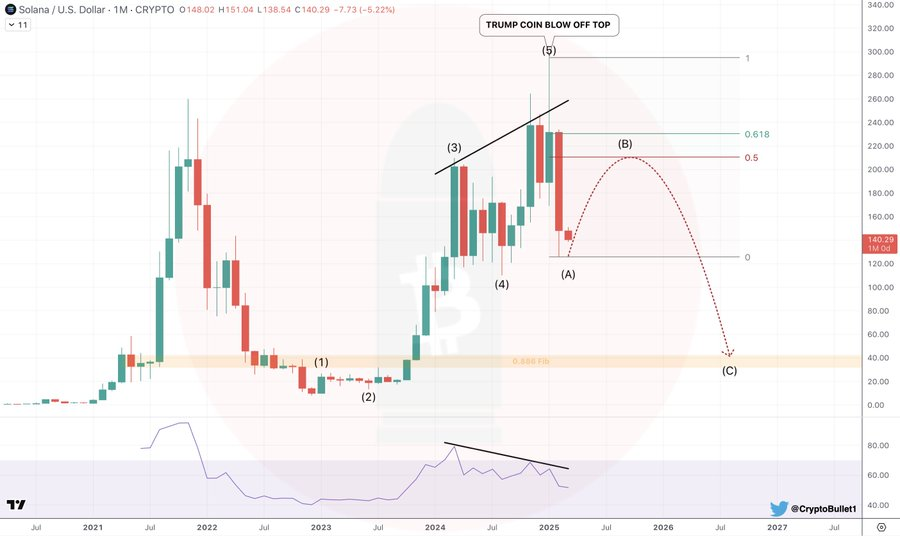
Solana traded at low levels in 2020 with minimal volatility. A major surge in 2021 pushed the asset to an all-time high. Large green candles indicate rapid price appreciation, followed by red candles confirming corrections. In 2022, Solana entered a prolonged bearish phase, with continuous declines leading to consolidation by early 2023.
Technical Indicators Point to a Potential Correction
By mid-2023, Solana entered a bullish phase, experiencing consistent price gains. Consecutive green candles marked a recovery, with the uptrend continuing into 2024.
Solana surpassed key resistance levels, breaking above $200. Strong market confidence and increased capital inflows supported this movement. The latest rally has reinforced a higher-highs and higher-lows pattern, signaling an extended bullish trend.
Investing.com reported that Solana’s current surge was sparked by the launch of Bitcoin. This news did much to create increased trading volumes, fueling the bullish fervor. The Fibonacci retracement levels indicate, however, that Solana would face resistance on the 0.618 mark before a possible pullback sets in. Traders have been estimating a likely fall to around the $40-$50 price range if pressure from the bears intensifies.