Key Insights
- Solana price rejected the $90 resistance zone as sellers defended the range high, increasing the probability of a corrective market phase.
- The current structure suggests an ABC correction where the recent rally may represent the B leg before potential downside continuation begins.
- Traders now focus on the $81 support zone since a break below this level could accelerate movement toward the value area low.
Solana price recently rejected the $90 level after buyers attempted to push above a major resistance zone within the current trading range. The rejection appeared as selling pressure increased near the range high where traders often protect previous resistance levels. Besides the structural barrier, the region also aligns with the value area high, which strengthens its importance in the current market structure.
Market Structure Signals Potential Correction
The latest price movement now points to a possible corrective phase as Solana remains below the upper boundary of its range. However, the market structure still reflects a broader consolidation rather than a confirmed directional breakout. Consequently, traders now monitor how price reacts within the established range as liquidity continues to rotate between key levels.
Technical analysis shows that Solana may be forming an ABC corrective structure, which often appears during temporary market pullbacks. In this structure, price moves through three phases before the broader trend resumes or changes direction. Significantly, the initial drop created the A leg while the recent rebound toward $90 likely formed the B leg.
Failure to Break Resistance Weakens Momentum
The inability to reclaim the resistance zone suggests that buying momentum may weaken in the short term. Moreover, traders often interpret repeated rejections at range highs as a signal that sellers remain active at those levels. Hence, the rejection strengthens the idea that Solana could now transition into the C leg of the correction.
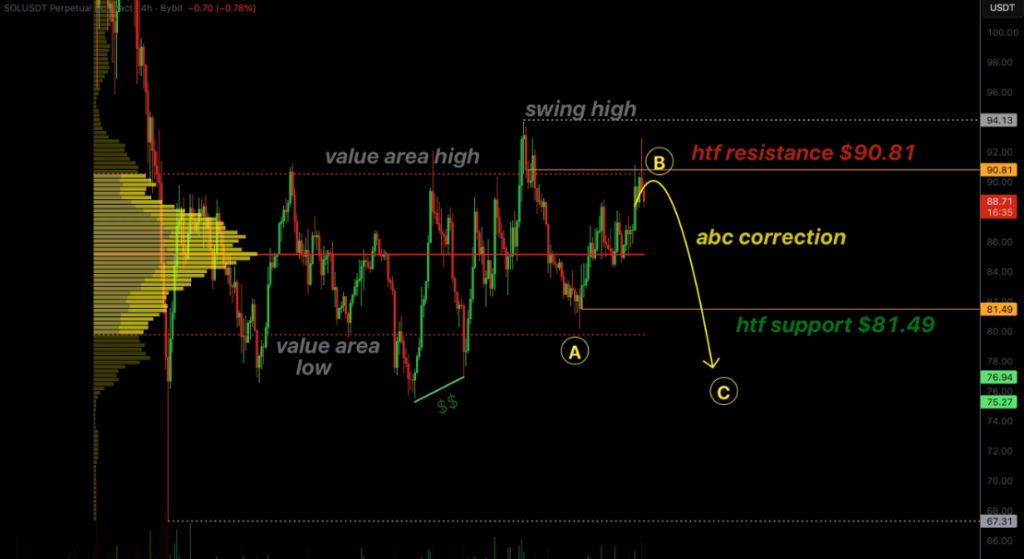
Market participants now closely watch the $81 level since it acts as an important support zone within the current structure. Additionally, this area sits near a region where previous demand appeared during earlier market rotations. However, a clear break below this support could increase bearish pressure and encourage a move toward lower liquidity zones.
Liquidity Zones Remain a Key Market Driver
Price action within range markets often rotates between the value area high and the value area low as traders search for liquidity. Moreover, swing lows below the current market price remain untested and may attract price movement if selling pressure increases. Consequently, these liquidity clusters could guide the next phase of Solana’s short-term market behavior.
Besides the technical developments, activity within the Solana ecosystem continues to expand through infrastructure projects and corporate initiatives. Additionally, companies have recently announced plans to strengthen Solana-based infrastructure in global markets. However, despite these developments, the current price structure still reflects a technical range environment.
The broader outlook now depends on whether Solana breaks below support or reclaims resistance. Moreover, traders continue to monitor the $90 level as the key barrier that controls bullish momentum. Hence, sustained trading below this resistance keeps the corrective structure active while support levels remain under pressure.