
- Solana may retest $206 support before aiming for $217 resistance within its current trading range.
- Trading volume tops $9.2B as SOL compresses between $200–$206, signaling possible breakout potential.
- Institutional demand rises with $15.8M ETF inflows, reinforcing Solana’s support near the $200 zone.
Solana (SOL) may dip to $206 ahead of a rebound toward $217, according to recent chart analysis. The cryptocurrency has been trading within a defined range of $195 to $217, and traders are closely monitoring key technical levels for upcoming movements. At present, Solana is trading at $204.

Support and Resistance Levels
The one-hour SOL chart indicates horizontal support around $206 and $195, with resistance near $212 and $217. According to analysis prepared by Ali Charts, the structure shows a breakout above $206 followed by consolidation near $208.
The dotted projection suggests a possible retest of $206 before advancing higher. Price movements show that SOL rebounded from the $195 zone, reaching above $210 before a slight pullback.
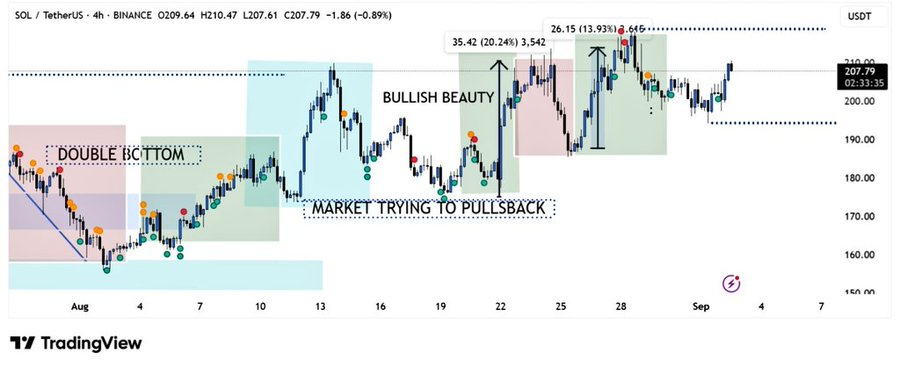
Market data indicates that buying pressure has been consistent above $206, supporting short-term recovery. According to an observation by BitGuru, Solana reversed from a double bottom pattern near $165 earlier in August, and since then, the asset has gained over 20%.
Trading Activity and On-Chain Metrics
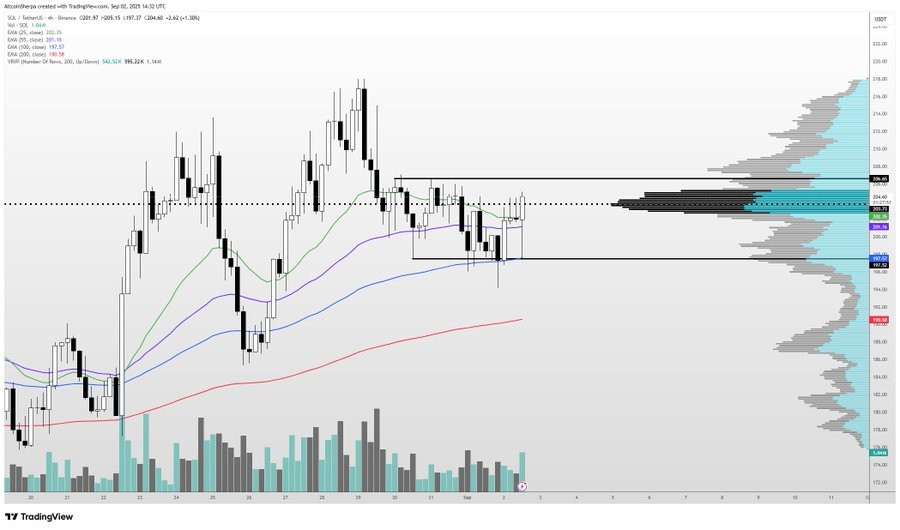
Trading volume has increased during recent sessions, with Solana recording over $9.2 billion in 24-hour trading activity. Analyst Altcoin Sherpa stated, “This Solana compression is huge. Tons of volume being transacted within this range and I think that we’re going to break up soon.” The Volume Profile shows clustering between $200 and $206, often linked with breakout potential.
On-chain metrics reveal mixed signals. The Net Unrealized Profit/Loss (NUPL) indicator has climbed to 0.30, a level that previously aligned with short-term corrections. Meanwhile, the Hodler Net Position Change metric shows reduced long-term holdings, indicating selling activity from early investors. Despite this, institutional demand is growing.
According to SolanaFloor, the first U.S. Solana staking ETF ($SSK) recorded $15.8 million inflows in a single day, raising total assets to $219 million. Solana continues to trade above key exponential moving averages on the four-hour chart, with the 200 EMA at $200 acting as dynamic support. If $206 holds, analysts see potential for a rebound toward $217, supported by both chart patterns and institutional inflows.