- Solana is holding firm at $219 with buyers in control, and strong momentum could soon push it back toward the $300 mark.
- Charts show strength across EMA, RSI, and MACD, but traders are keeping a close eye on $222 as the key breakout level.
- With ETF excitement and steady institutional demand, Solana’s path higher looks strong as long as bulls defend crucial support zones.
Solana is picking up speed, showing strong signs that buyers are in control. The coin is now trading at $219.28 after rising 2.02% in the latest session, and momentum is building for its next big move.

Over the last 90 days, SOL has advanced sharply from July’s $145 levels, climbing through key resistance points and establishing higher lows. Analysts now watch closely for a potential breakout that could send Solana toward its previous highs near $300.
The rally coincides with growing interest from digital asset trusts and the anticipation of exchange-traded funds. According to analyst Lark Davis, “Solana continues to show a lot of strength,” noting that despite a rising wedge pattern, ETF inflows could push prices upward.
He added that traders should monitor support near $206 and resistance at $222, as a decisive move in either direction could determine the next leg.
Technical Indicators Confirm Strength
On the chart, exponential moving averages provide support for the ongoing positive momentum. The fifty-day EMA is at $194.13, while the twenty-day EMA is at $204.14. The increasing trajectory of the asset is confirmed by both averages trending upward.
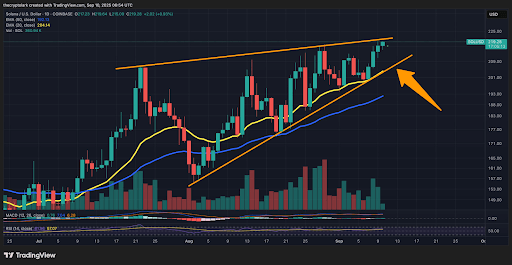
Additionally, the MACD indicator exhibits a bullish crossover, with momentum readings getting stronger as the histogram moves into the positive zone.
Recent trading shows about 360,940 SOL tokens changing hands, proving strong activity in the market. Most of this trading came from buyers, which kept pushing prices higher, while selling remained relatively small. The strength indicator, known as RSI, now sits at 57, showing healthy momentum without the risk of the market being overheated.
Ascending Channel Guides Price Action
An ascending channel pattern is followed by the SOL price action, with both the upper and lower bounds remaining firmly in place. As the rally went on, prior resistance levels turned into support, and pullbacks frequently found support along the lower trendline. With few upper shadows and a string of green candles fueling the upward momentum, recent candlestick closes exhibit great conviction.
Solana looks strong right now, with several market signals backing its upward trend. If the price climbs above $222 and stays there, experts believe it could rise further, possibly reaching the $300 level.