
- Solana faces firm resistance at $253, with recovery above $200 seen as key for momentum shift.
- ETF progress and easing outflows suggest improving sentiment and potential for near-term rebound.
- Holding above the 200-day EMA near $186 could support a move toward $210–$250 range.
Solana (SOL) faced strong resistance near the $253 level, forming a temporary bullish structure before moving into a clear downtrend. After several failed breakout attempts above this price zone, the market corrected sharply. However, a sustained recovery above $200 could shift momentum and open a new path for further gains.

Market Correction and Price Structure
According to analysis prepared by BitGuru, Solana’s 4-hour chart between mid-September and mid-October showed a strong advance toward $253 before a reversal began. The market then transitioned into a downward phase, displaying a pattern of lower highs and lower lows, confirming consistent selling pressure throughout the period.
A consolidation area labeled “Bullish Beauty” formed near $240 before another rejection occurred. After this stage, sellers dominated market activity, and Solana’s price moved below $200. The asset later found short-term support near $180, where a minor pullback attempt emerged. The structure suggests that a close above the $200–$207 range could signal a possible change in short-term direction.
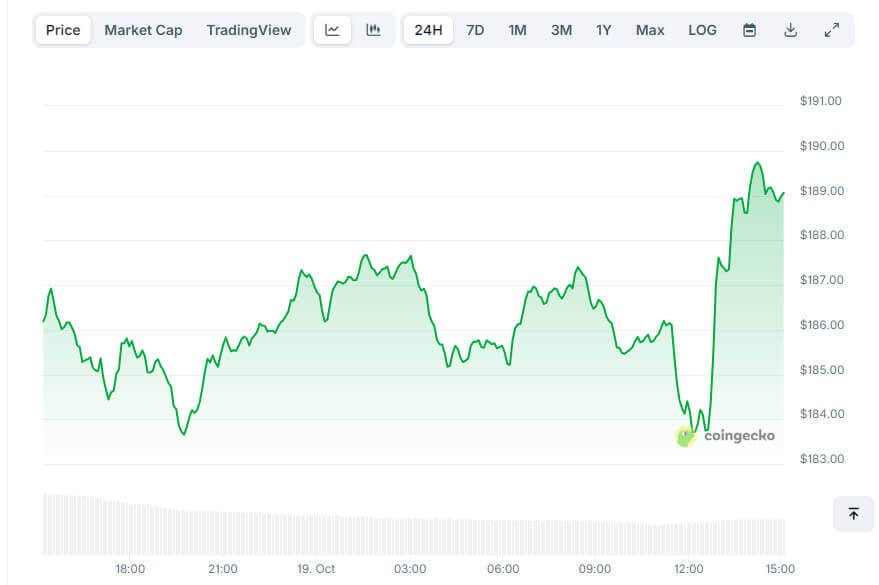
According to data from Coingecko, Solana traded within a 24-hour range of $183.66 to $189.74, posting a 1.5% increase to reach $189.11. Market capitalization stands near $103.31 billion, supported by $4 billion in daily trading volume, reflecting active participation from traders and investors.
ETF Progress and Technical Outlook
The U.S. SEC’s approval of 21Shares’ Form 8-A registration for the Solana Spot ETF marked a key step toward a listed product on the Cboe BZX Exchange. This development positions Solana as the next major altcoin after Bitcoin and Ethereum to approach ETF status.
Data from Coinglass shows Solana recorded a $6.88 million net outflow on October 18, among the lowest in recent weeks. Analysts say the smaller outflows point to stabilization in market sentiment following a period of heavy selling. Immediate resistance levels are seen at $203 and $207, where the 20-day and 50-day EMAs converge.
A confirmed breakout above these areas could open the path toward $246, $253, and $270. On the downside, support remains stable at $181 and $170. Technical indicators remain favorable that Solana rallies above 200-day EMA of around $186 in the near future that could result in further gains to $210 and $250 with the help of improving liquidity and optimism held by the ETF.