
- Solana’s inverse head-and-shoulders pattern suggests a possible price movement toward the $180 level.
- The breakout above the neckline points to a projected 6% increase from current levels.
- Holding support above the neckline could sustain upward momentum, with market volume confirming the breakout’s strength.
Solana (SOL) has formed an inverse head-and-shoulders pattern on lower time frames, indicating a possible price movement toward $180. This technical formation, widely monitored by traders, is setting the stage for a potential 6% increase from its current levels.
Pattern Formation Suggests Possible Price Movement
According to Ali Charts observations, SOL displays an inverse head and shoulders pattern, indicating a shift from a downtrend to an uptrend. The price declined sharply before stabilizing, forming the left shoulder.
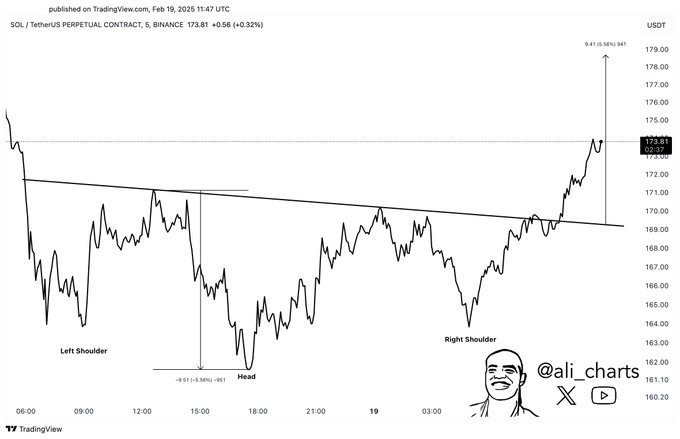
A deeper drop created the head, followed by a recovery. The right shoulder formed as prices consolidated before breaking above the neckline. The breakout led to a sharp upward movement, with the price reaching 173.81 USDT. The projected target stands near 179.00 USDT.
Market data indicates that Solana’s price action has shaped an inverse head-and-shoulders pattern over recent trading sessions. This structure, characterized by three consecutive lows, with the middle being the lowest, often signals a shift from downward pressure to upward momentum. The neckline resistance level was recently challenged, with $SOL now attempting to sustain its breakout above this critical point.
Key Levels to Watch Moving Forward
Following the breakout attempt, Solana’s immediate focus lies on maintaining support above the neckline. Should the asset hold above this threshold, momentum could continue toward the $180 target. Market participants are closely observing volume levels to confirm the strength of the breakout, as heightened activity often accompanies sustained price moves.
Conversely, a failure to hold above the neckline could cause Solana to retest lower support zones. Despite the recent breakout, price action remains sensitive to broader market dynamics and liquidity conditions.
Traders monitoring this setup have noted that a confirmed breakout could pave the way for a move toward the $180 mark. The projected 6% price increase is calculated by measuring the distance between the pattern’s lowest point and the neckline then applying it above the breakout level.