
- Solana holds above key support with higher lows, showing resilience as traders eye the $220-$225 resistance and the $270 all-time high.
- Rising wedge momentum and strong recovery from $120 highlight buyer conviction while volume spikes confirm sustained investor participation.
- SOL trades 19 percent below its 2021 peak as bulls wait for a breakout, with moving averages signaling a steady bullish trend.
Solana (SOL) is approaching a key resistance level with the cryptocurrency currently trading at $218.68 having declined 4.57% in the last session as per Crypto analyst Daan Crypto Trades chart. Despite the dip, market structure shows resilience, with expectation for a potential retest of the 2021 highs.

Rising Momentum and Technical Structure
Daan Crypto Trades noted that SOL has been grinding higher inside a rising wedge pattern. The 2021 all-time high of $270 remains the ultimate resistance. This red-marked level is now a key psychological target for traders eyeing a breakout.
Besides, technical indicators highlight strong support zones. The Daily 200EMA at $172.51 and the Daily 200MA at $158.41 provide crucial benchmarks. These averages guide traders on potential reversal points and confirm the broader bullish structure.
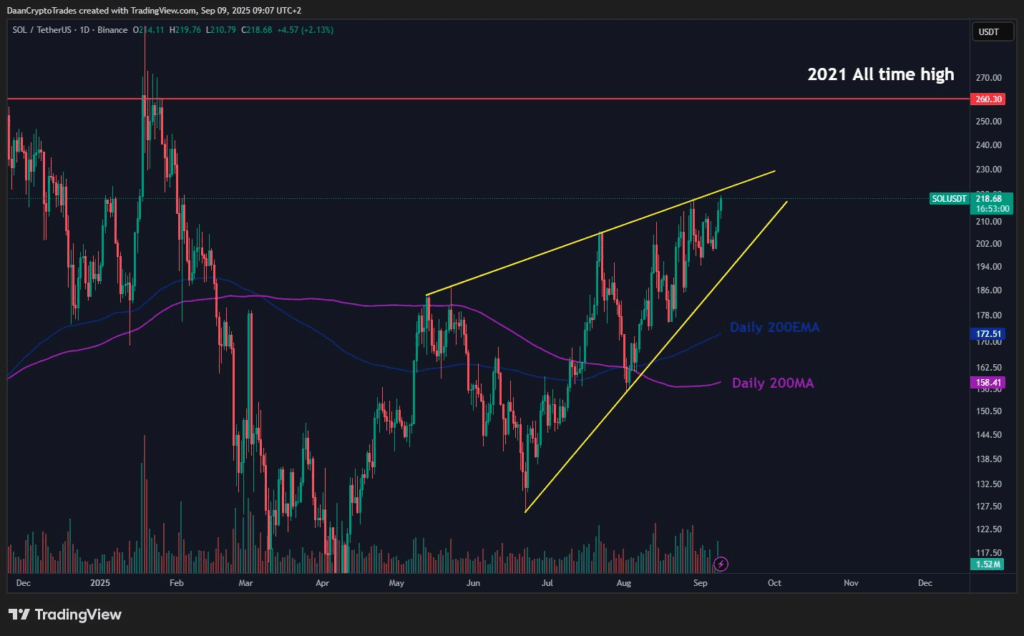
Source: Daan Crypto Trades
Moreover, a yellow ascending trendline has supported SOL since mid-2025. The ascending channel pattern that keeps defining the direction of the market is supported by this dynamic line that crosses between $180 and $190.
Market Activity and Investor Sentiment
Trading volume spikes align with major breakout attempts, signaling conviction behind moves. Higher activity has historically confirmed price direction, whether upward or downward. Consequently, traders now watch closely as SOL trades above both moving averages, sustaining bullish momentum despite the latest pullback.
Additionally, recovery patterns this year reinforce confidence. SOL has rebounded multiple times from the $120 zone, demonstrating consistent buyer interest and accumulation during corrections. Market structure also shows higher lows, reflecting steady accumulation and investor optimism.
However, immediate resistance between $220 and $225 is slowing momentum. Breaking above this zone could clear the path toward retesting the $270 peak. At present, SOL sits about $51 below that high, marking a 19% gap. This setup reflects consolidation before the next decisive move.
Solana’s technical structure highlights resilience in a volatile market. Investors see strength in higher lows and institutional activity, but the breakout above resistance will define its next major trend.