
- Solana approaches $79.04 resistance, where a confirmed breakout could expose upside targets at $83.98 and $88.00.
- Buyers could return to the $75.00-$73.39 demand zone if resistance is encountered and another bull market initiative forms.
- Losing $73.39 would weaken the current recovery, exposing downside levels at $67.92 and $64.04.
Solana remains beneath a major resistance zone as traders monitor breakout confirmation while watching nearby demand for another possible recovery attempt.
Resistance Near $79.04 Remains The Main Decision Point
Finora AI shared an updated eight-hour outlook outlining the next technical roadmap. The post identified $79.04 as the immediate breakout level. Buyers require volume and momentum before confirming a sustained advance.
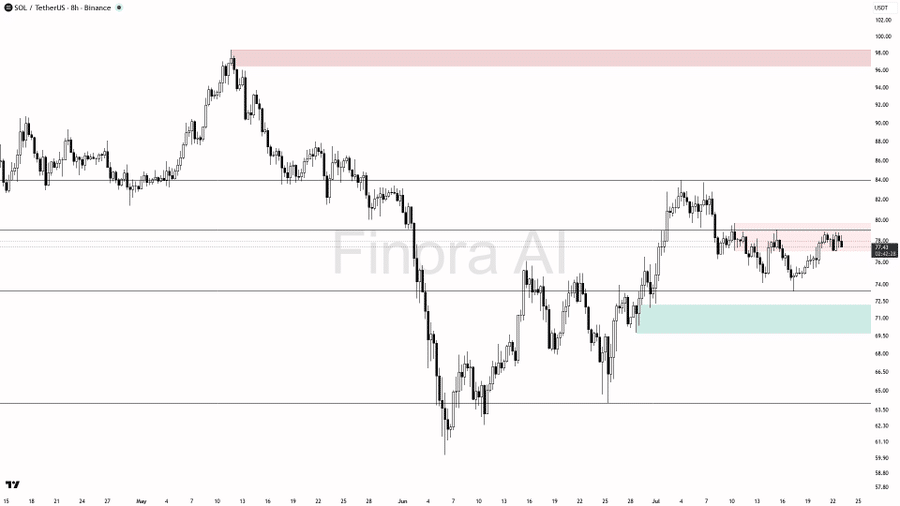
A confirmed close above $79.04 would strengthen the bullish structure considerably. The first upside objective sits at $83.98 after breakout confirmation. Strong continuation could then extend the advance toward the $88.00 region.
Solana as of writing, trades at $77.50, remaining below the critical resistance. The intraday chart reflects tight consolidation after recovering from earlier weakness. Buyers continue defending nearby support despite repeated selling attempts.
The broader recovery followed a prolonged decline from the $98-$99 region. Buyers gradually rebuilt higher lows after defending the $60-$64 support area. That recovery eventually reached the recent swing high near $83.98.
Demand Zone Offers Alternative Bullish Opportunity
If resistance rejects price again, attention shifts toward the $75.00-$73.39 demand area. Finora AI described this region as an important fair value gap. A sweep into demand could attract renewed buying interest.
However, confirmation remains necessary before considering another upward move. Bullish engulfing candles would strengthen the recovery scenario after a pullback. Lower-timeframe structure breaks could provide additional technical confirmation.
A successful bounce would place $79.04 back into immediate focus. Reclaiming resistance would reopen the path toward the recent swing high. Sustained buying pressure could eventually target the projected $88.00 objective.
The intraday structure supports that conditional outlook. Price repeatedly reacted around the $77.50-$77.60 equilibrium area. Consequently, buyers continue defending this region during short-term market fluctuations.
Breakdown Scenario Points Toward Lower Targets
The bullish structure changes if price closes beneath $73.39 without recovering quickly. Finora AI stated that such action shifts the broader bias bearish. Sellers would then gain stronger technical control.
Under that scenario, the first downside objective stands near $67.92. Continued weakness could extend losses toward the $64.04 support level. Those areas align with previous recovery structure on the higher timeframe.
The shorter-term chart also identifies nearby support around the $77.00 region. Losing that level could expose additional weakness toward approximately $76.50. Meanwhile, reclaiming $78.50-$78.70 would improve immediate momentum.
Overall, the technical roadmap remains driven by clearly defined price levels. The breakout above $79.04 suggests that higher levels of $83.98 and $88.00 are in play. In case of a failure below $73.39, it will focus on $67.92 and $64.04.