
- Solana is forming a strong bullish triangle pattern, signaling a potential breakout.
- Analyst targets a $300 to $500 price range, backed by Fibonacci levels.
- RSI remains stable, showing room for further upward movement in price.
With a target range of $300 to $500 within its current bullish wave structure, analyst Mikybull Crypto has made a strong case for Solana (SOL) to see gains. His recent analysis, published alongside detailed charts on TradingView, highlights critical patterns and conservative projections while addressing the broader sentiment on calling the token’s potential cycle top prematurely.
Ascending Triangle Suggests Explosive Continuation Toward Wave (5) Targets
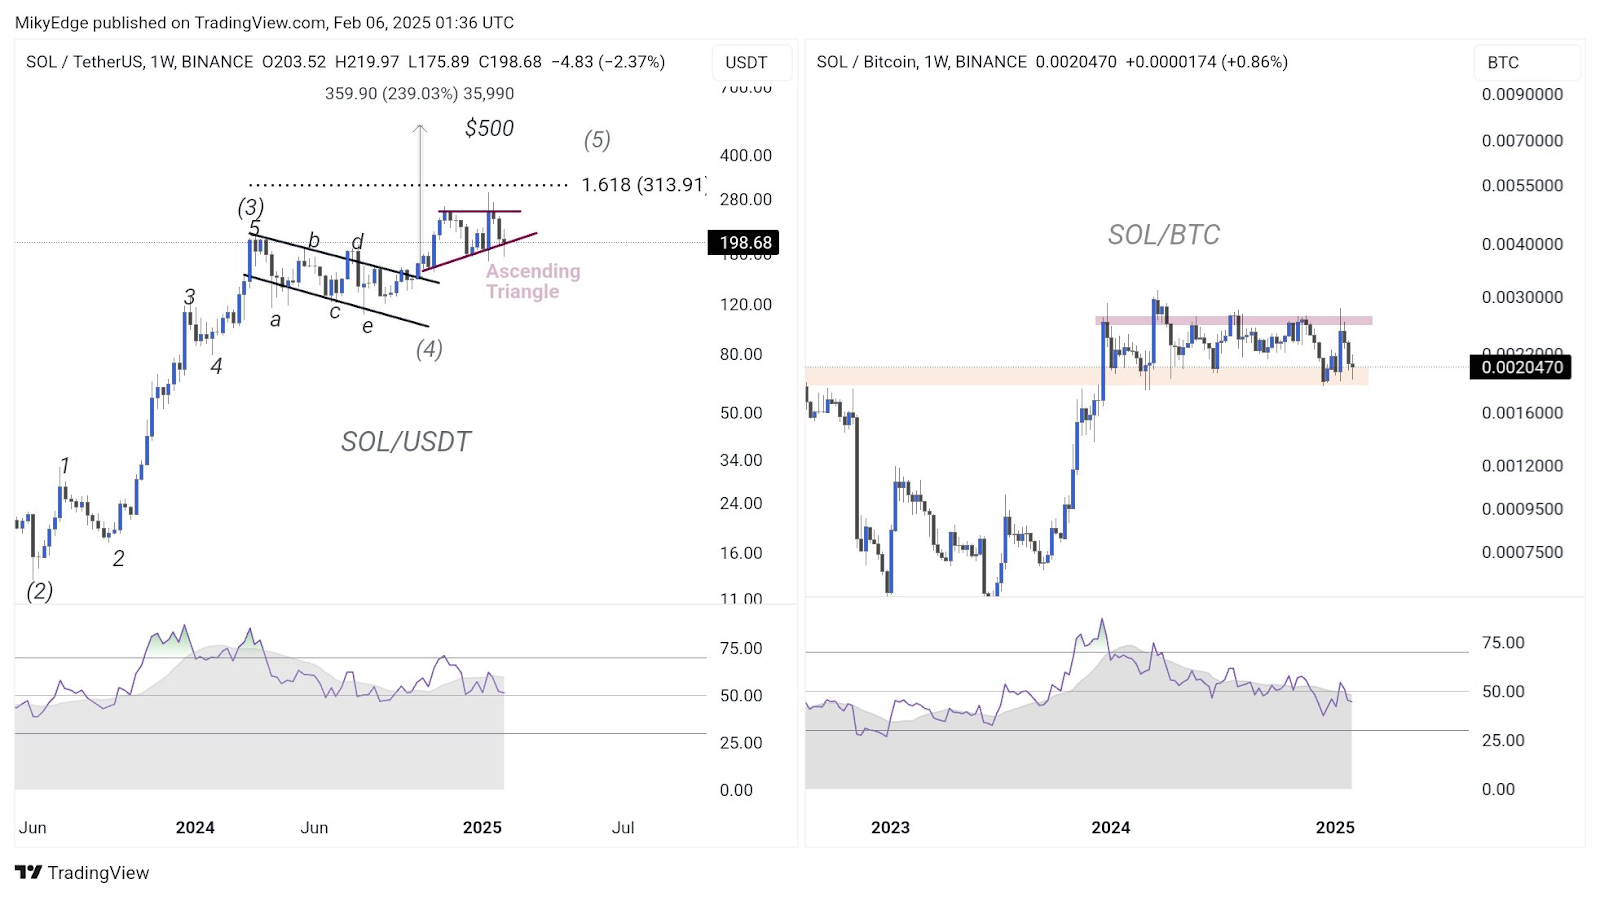
In the SOL/USDT weekly chart, Mikybull underscores the ongoing development of an ascending triangle, a bullish continuation pattern. This formation is situated just below the 1.618 Fibonacci extension level at $313.91, which aligns with the trajectory of wave (5) within the Elliott Wave theory.
The structure has seen a clear five-wave cycle unfold, culminating in the anticipation of a sharp move upward. The conservative targets for this wave stretch between $300 and $500, reflecting potential gains of up to 239% from the current levels around $198.68.
The analyst explicitly warns against premature declarations of a cycle top, emphasizing that such assumptions are “nothing short of bad technical analysis.” Instead, he advocates for letting the market dictate its direction, with clear invalidation levels embedded in the structure.
SOL/BTC Pair Holds Key Horizontal Levels Amid RSI Stability
On the SOL/BTC chart, Mikybull shifts focus to the horizontal resistance zone around 0.002470 BTC, where Solana has oscillated within a well-defined range. The consolidation suggests indecision but hints at a potential breakout if buying momentum aligns with the broader market trend.
The weekly RSI (Relative Strength Index) on both the SOL/USDT and SOL/BTC pairs remains steady, signaling that the market has yet to reach overbought conditions, leaving room for further upside movement.
This BTC pairing chart underscores that the $300–$500 price target in dollar terms is well-supported if Solana continues to maintain its strength against Bitcoin, especially as market sentiment remains cautiously bullish.
Market Sentiment and Broader Perspective
Mikybull’s analysis resonates with crypto enthusiasts who believe that Solana’s fundamentals and technical setup remain robust. While the ascending triangle provides a bullish tilt, he highlights that invalidation would occur if SOL dips below the critical support levels, signaling a potential breakdown. However, with the ongoing pattern holding firm, the optimistic $500 mark represents a highly plausible scenario for the token, assuming broader market stability.
In a touch of humor, Mikybull acknowledges the overzealous predictions floating around, urging his audience to “allow the market to decide the direction.” His balanced yet bullish stance underscores the importance of technical precision in crypto trading.