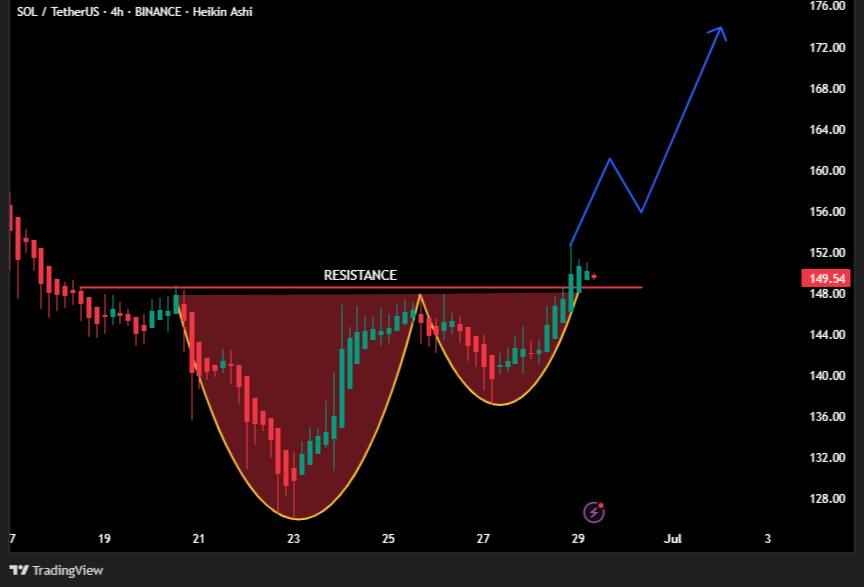
- Solana breaks $149.54 resistance after forming a textbook cup and handle, targeting a short-term rally toward the $172–$176 zone.
- SOL’s chart shows higher lows and bullish candles post-June 27, with $149 now acting as strong support as momentum accelerates.
- A July Solana staking ETF could attract institutional inflows, reinforcing bullish sentiment and driving sustained upward movement.
According to analyst CryptosBatman, Solana (SOL) has broken out of a key resistance level after forming a textbook cup and handle. At $149.54, a level that had previously repelled several bullish efforts, the breakout took place. From June 19 to June 29, this structure validates a bullish reversal pattern. A potential short-term rise toward the $172–$176 price range is presently indicated by technical signs. As momentum increases, market mood turns positive. With the neckline break confirming the bullish thesis, traders are now concentrating on $149 as fresh support.
Cup and Handle Pattern Fuels Uptrend
The 4-hour Heikin Ashi chart on Binance reveals a double-bottom pattern within a broader cup and handle formation. SOL initially dipped to $134 on June 23 before rallying to $149 by June 25. The price then retraced to $138, forming the second trough of the pattern. A rapid rebound followed, completing the cup’s right side.
Source: CryptosBatman
Additionally, a brief consolidation formed the handle just before the breakout. The resistance line at $149.54 finally gave way on June 29. The breakout candle closed above this line with strong bullish momentum. Candlestick action showed higher lows and higher highs, confirming consistent upward price pressure.
Moreover, the chart projection outlines a move toward $172–$176. A brief stop is expected around $156 before further gains. These targets align with the measured move principle from classic cup and handle patterns.

Bullish Momentum Builds Ahead of July Catalysts
Momentum appears to be increasing, especially after June 27, when green candles began dominating the chart. The breakout occurred with conviction, signaling buyer strength. Though volume indicators remain absent from the chart, price action reflects bullish dominance.
Besides, a potential Solana staking ETF announcement in July could bring institutional inflows. Consequently, SOL may witness increased demand as investors position for exposure through regulated products.
Price structure and market behavior support continuation. The former resistance now acts as a support level. The current bullish formation, along with macro catalysts, enhances short-term upside potential.