- Solana holds support at $146–$148, a key demand zone linked to prior accumulation phases.
- Technical indicators show bullish momentum with RSI recovery and MACD crossover on short-term charts.
- Resistance stands at $154.21; a break above may lead to a retest of the recent $159.99 high.
Solana (SOL) is retracing after facing rejection near the $160 resistance level. The price has now entered a key demand zone between $146 and $148, where previous accumulation occurred. Price action is beginning to stabilize in this range, and technical data shows the structure remains healthy, with bullish potential still present in the current setup.

Price Stabilizes After Pullback With Support Holding Near $146
SOL reached a weekly high of $159.99 on July 1 before undergoing a gradual retracement. The asset moved down to a local low of $146.17 on July 2, then rebounded and is now trading at $148.05.
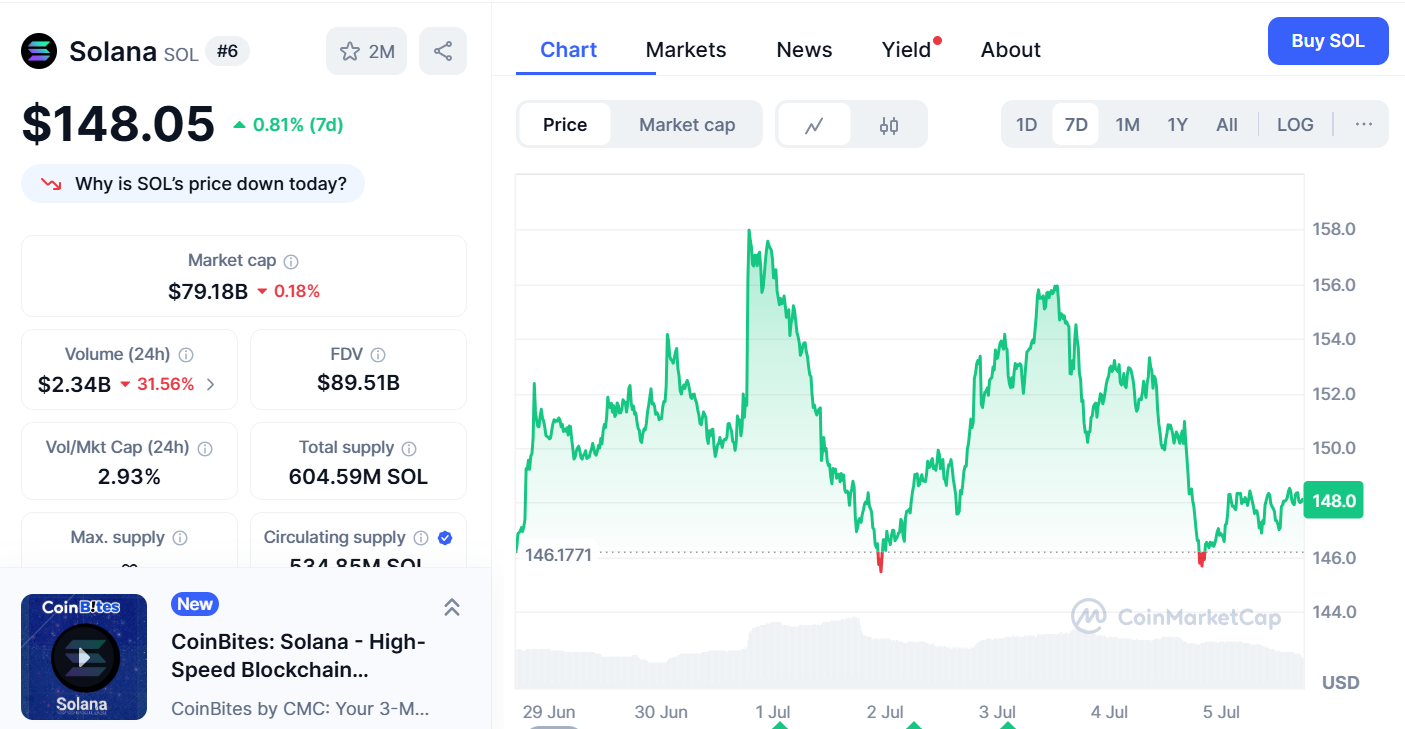
The price gained 0.81% over the past seven days. CoinMarketCap data reports a $79.18 billion market cap and a 24-hour trading volume of $2.34 billion, showing a 31.56% drop from previous levels. The 4-hour chart shows a sequence of higher lows since the June 23 bottom at $126.00.
Price has held above the $146.73 zone several times, showing ongoing buyer presence. According to analysis prepared by Suzzy Defi, the current retracement places SOL back into a key support range that has historically triggered upward moves. The structure remains intact as long as price holds above this zone.
Technical Indicators Align With Potential Upward Movement
Gemxbt reported a bullish crossover in moving averages on the 1-hour chart. The RSI is trending upward from oversold territory, suggesting increasing momentum. MACD also shows a bullish crossover, indicating a potential shift in short-term trend.

Volume is gradually recovering, supporting the case for renewed buying interest. Fibonacci retracement levels from the $118 to $160 move position the 0.382 and 0.5 zones near current levels.
Resistance remains near $154.21, with the next level around $159.99. If buyers sustain pressure and price closes above $154, Solana could revisit the upper range of this recent high.