- Solana holds the $130 pivot as price trades in an upward structure targeting the $250 zone.
- SOL consolidates between $130 support and $293 resistance while buyers maintain higher lows.
- A multi-year Cup and Handle pattern places a long-term projection near $2,000 according to analysts.
Solana trades above the $130 support after a clean bounce that restored short-term strength across the market. The weekly structure shows steady reactions along the rising trendline that has guided price since early 2023, and traders now focus on the $130 pivot because this level defines the next directional phase. Sustained acceptance above $130 keeps the $250 upside target active.
SOL Holds the $130 Pivot and Builds a Stable Structure
Solana is trading above long-term support while remaining under the wider resistance zone near $293.13. The market continues to move between the ascending trend support and the broad horizontal zone created across 2024 and 2025. The latest retest of the rising trendline produced a stable reaction, and the asset held within a wide support area.
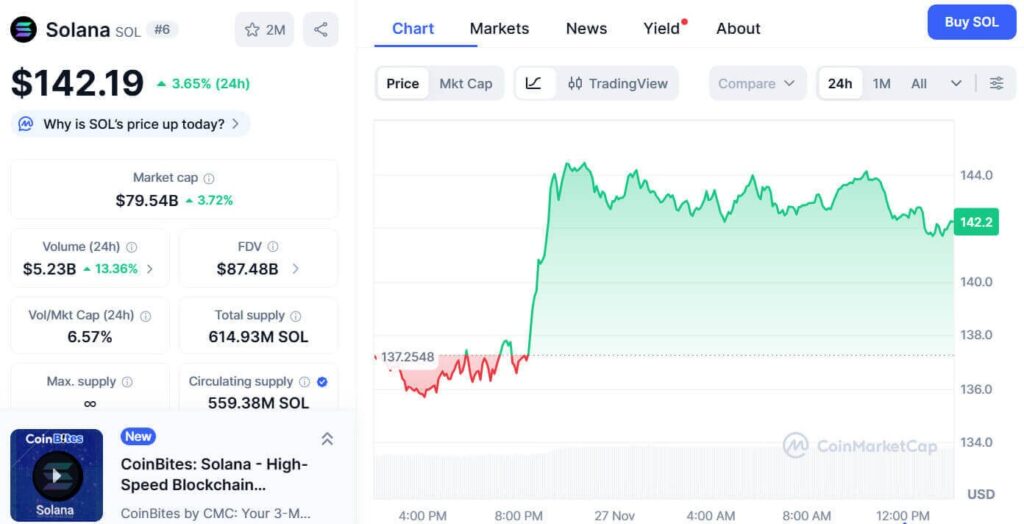
CoinMarketCap data shows SOL trading near $142.19 with a 24-hour gain of 3.65$ while volume rose more than 13%. Price moved from the $137 region into the $143 area, and the chart recorded steady buying interest around $140. The market formed higher lows across the 24-hour period, and buyers kept control as SOL moved within an upward channel.
According to an observation by CryptoPatel, continued strength above $130 maintains the broader range and keeps the $250 target open. The structure has rejected the $293 zone many times, and SOL continues to consolidate between this resistance and the $130 base.
Key Risk Zones and Long-Term Pattern Developments
If buyers fail to hold the $130 level, the structure turns bearish and exposes the lower retracement areas. Chart data shows the 0.382 Fibonacci retracement near $75 and the 0.5 level near $50. Both zones align with past accumulation periods from early 2023, and the weekly chart also shows a Fair Value Gap between these levels.
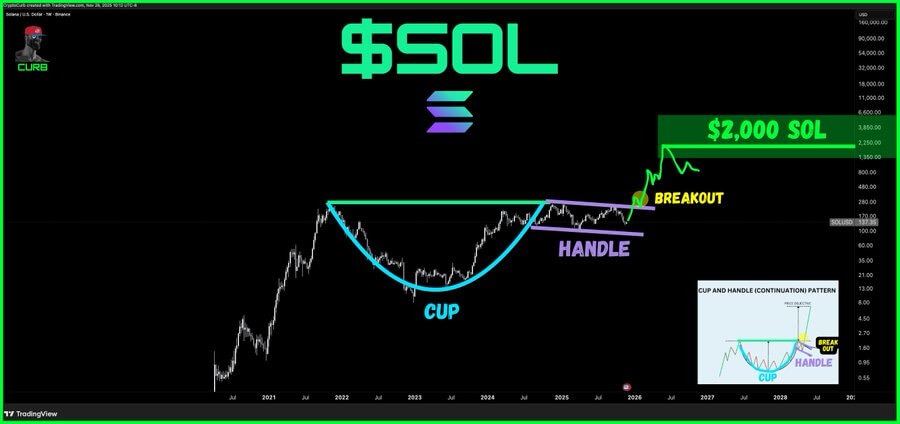
According to analysis prepared by Crypto Curb, Solana also forms a multi-year Cup and Handle pattern with a projected target near $2,000. The pattern shows a broad rounded base from 2021 to 2023 while the handle forms under horizontal resistance.
The breakout moves into a rising structure, and the projection aligns with the long-term target area. The $130 pivot remains the central level for trend confirmation as SOL continues to trade in a stable structure.