- Solana price nears $191–$194 resistance, aligning with the descending trendline and signaling potential rejection and short-term bearish movement.
- Long-term Elliott Wave analysis projects a Wave 5 rally, with Solana price potentially reaching $295–$300 within the ascending daily channel.
- $185–$188 and $195–$200 are support and resistance zones respectively.
Solana price is up 3.18% for the week at $193.18. Traders are keeping a close eye on resistance levels to see if it breaks higher or pulls back
Short-Term Resistance and Downtrend Pressure
Analyst Marcus Corvinus noted that the $191–$194 range aligns with the descending trendline, and suggested a possible rejection. The price behavior in this zone may determine whether bears regain control.
The trendline shows a pattern of lower highs, a sign of persistent bearish momentum in recent sessions. A pullback from $191–$194 could lead Solana toward the $170–$165 support. This movement would follow the broader downtrend structure, of lower highs and lower lows.
Stops above $194 are suggested for short positions, while a decisive breakout above $195 could invalidate the bearish scenario. Market participants are likely to wait for confirmation in this region before making significant trades.
Long-Term Wave Structure and Potential Rally
Matthew Dixon (@mdtrade) presented a longer-term Elliott Wave outlook for Solana price, projecting a Wave 5 rally toward $295–$300.Wave 4 low near $180 provided strong support for this projected advance.
The bullish scenario assumes price continuation within the upper half of the channel, creating higher highs and higher lows. RSI readings near 46–47 suggest upward momentum is possible without immediate overbought conditions. A breakout above $200 may signal the start of Wave 5.
A breakdown below $180 would challenge this bullish wave count and indicate potential trend reversal. Traders are likely observing the channel’s dynamic support and resistance boundaries to identify entry points for long positions.
Market Liquidity and Price Equilibrium
Solana’s order book heatmap displays concentrated liquidity zones between $185–$188 and $195–$200. Bright regions represent high trading interest, where significant buy or sell orders may influence price direction. Price consolidation near the upper liquidity zone suggests temporary market indecision.
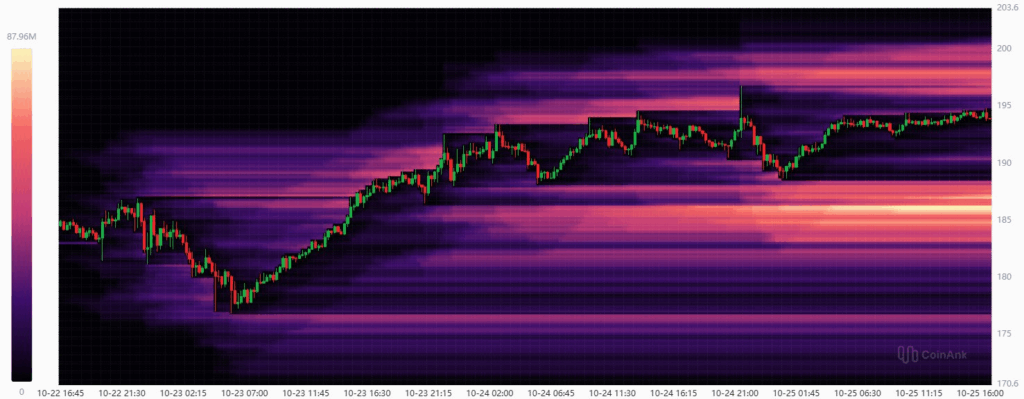
The $185 support cluster helps absorb selling pressure and maintain upward momentum. Conversely, the $195–$200 area represents resistance, where sellers may place large orders. A breakout above $195 could trigger stop orders and accelerate movement toward $200+.
Overall, traders are monitoring liquidity distribution and price behavior to determine the next major directional move. Market equilibrium appears to be guiding Solana price as it navigates these technical zones.