
- SHIB’s inverse head and shoulders pattern signals bullish momentum, with a potential breakout aiming for the $0.000081 target.
- Historical cycles show SHIB following a pattern of accumulation, breakout, and expansion, reinforcing its bullish setup.
- A neckline breakout could confirm a strong rally, pushing SHIB into a price discovery phase with significant growth potential.
Shiba Inu (SHIB) is forming a large inverse head and shoulders pattern, signaling strong bullish momentum. Analysts predict a potential breakout that could push prices over 400% higher, targeting the $0.000081 mark.
SHIB Market Structure and Formation
According to Javon Marks’ analysis, SHIB’s time frame is forming an inverse head and shoulders pattern, indicating a possible trend reversal. The left shoulder developed after a decline, followed by a temporary recovery and another drop. The head formed at a lower level, marking the lowest point in the structure. A right shoulder then emerged, maintaining symmetry with the left shoulder.
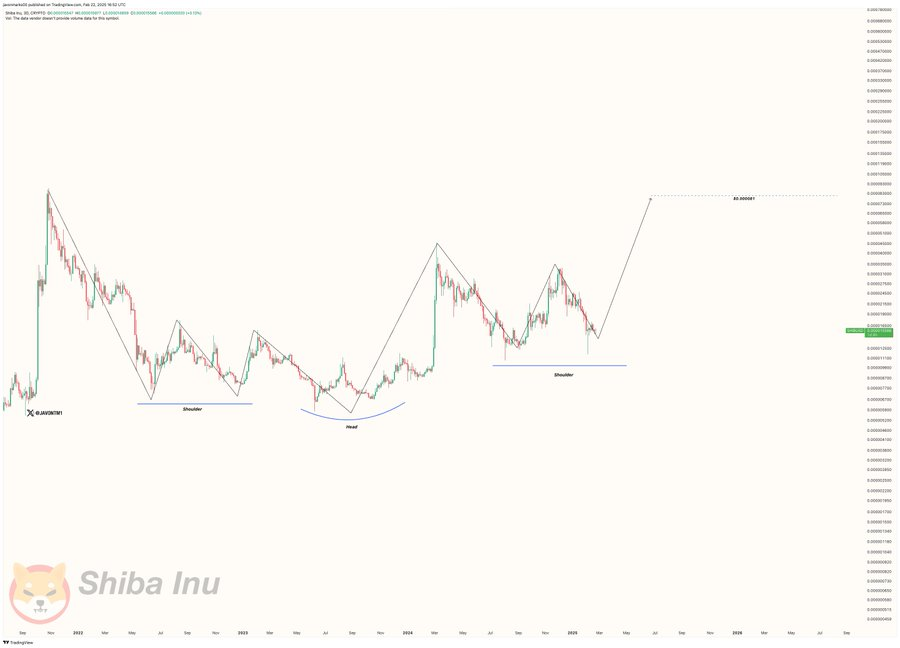
Price movements leveled off at a horizontal support level when the right shoulder formed. When the price breaks above the neckline, this pattern has historically resulted in significant reversals. A breakout might validate the bullish setup and possibly start a long-term upward trend if SHIB keeps this structure. The price fluctuations in the past show a recurring pattern of accumulation, breakout, and expansion.
SHIB has followed this pattern consistently, forming higher peaks over time. The projected price movement suggests a breakout towards the $0.000081 level, representing over 400% growth. Fibonacci retracement levels align with critical resistance zones, reinforcing potential breakout points. The resistance level above the shoulders has previously limited upward momentum. A breach of this level could validate the next leg of the uptrend, signaling further price appreciation.
Further Analysis
Marks highlights that SHIB appears to be finalizing its right shoulder. If the market structure remains intact, the token could be on the verge of a major breakout. Additionally, past market cycles support this pattern, with prices surging after breaking key resistance levels.
If SHIB maintains the current trajectory, a price discovery phase could follow, leading to substantial gains. The neckline remains a crucial indicator, as breaking above it could confirm the bullish continuation.
Overall, SHIB’s market structure demonstrates a strong accumulation and breakout cycle. If the formation holds, the expected price movement could mirror previous bullish runs, driving significant gains. The pattern aligns with historical market behavior, reinforcing the possibility of a sustained uptrend.