- Shiba Inu breaks year-long downtrend and confirms bullish structure with higher lows and growing accumulation since mid-2023.
- MACD bullish divergence forms with price making lower lows and indicators showing strength, signaling a potential major trend reversal.
- Market cap rebounds above $7.2 billion after sharp volatility, signaling fresh accumulation and returning confidence among SHIB holders.
Shiba Inu (SHIB) is back in focus as fresh bullish signals begin to show up on the charts. The token is trading at $0.00001235 as at press, down 1.78% in the last 24 hours, but still up 1.20% over the past week. With strong breakout patterns forming and over $230 million in trading volume, SHIB is showing signs of strength. The Shiba community is watching closely, as momentum builds and the stage sets for a possible big move ahead.

SHIB Breaks Out of Downtrend, Bullish Targets Ahead
After a long period of price decline, SHIB finally broke out of its downward trendline in mid-2023. This breakout was followed by a successful retest, where the old resistance turned into support — a key bullish sign. Since then, SHIB has been forming higher lows, which usually means investors are buying the dips and accumulating the token.
Crypto analyst Javon Marks on X shared a detailed chart showing a bullish divergence forming on the MACD histogram. This happens when the price makes lower lows but the MACD makes higher lows — a sign that selling pressure is fading. Based on this, the analyst believes SHIB could see a big upside move. Price targets of $0.00007853 and even $0.0001 were shared, with the potential for gains over 500% if momentum continues.
Momentum Builds as Technical Indicators Improve
On the short-term chart, SHIB is also starting to show positive signs. The MACD has just made a small bullish crossover, which means the trend might be shifting upwards. At the same time, the MACD histogram is turning green — another early signal of buying interest.
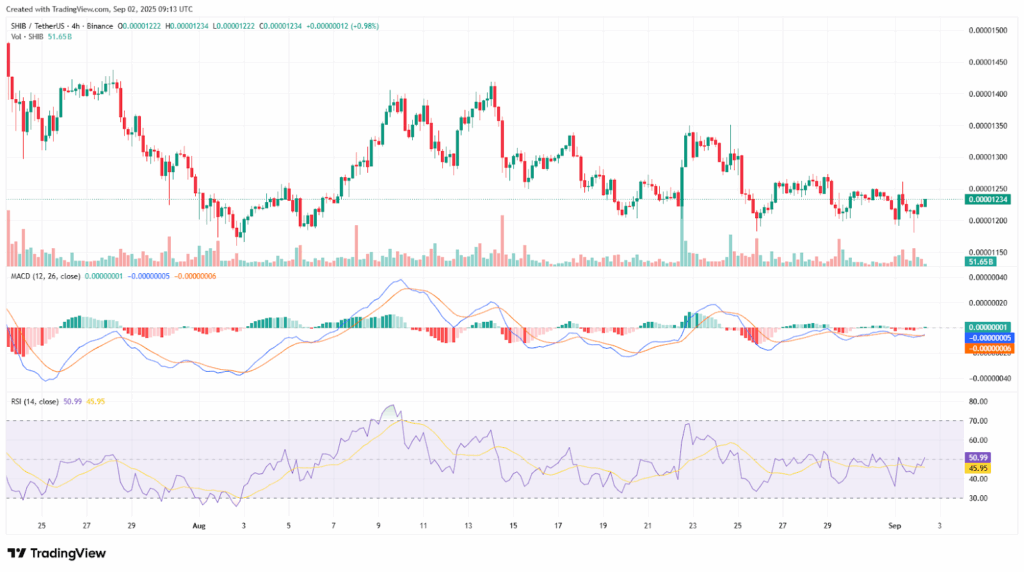
The RSI is now at 50.99, just above the neutral zone. This suggests that buyers are gaining strength, but SHIB isn’t yet overbought. If buyers can push it above $0.00001350, a bigger move could follow.
Market Cap Rebounds After Volatile Week
SHIB’s market cap saw major swings between August 27 and September 2, jumping from $6.90 billion to $7.45 billion, then falling back below $7.00 billion. This kind of movement shows both investor excitement and quick profit-taking.
However, a strong V-shaped recovery began late on September 1, pushing SHIB’s market cap back above $7.20 billion. This rebound hints at fresh accumulation and growing confidence among holders.