
Key Insights:
- Shiba Inu price consolidation within a symmetrical triangle points to a potential breakout, signaling a shift in market dynamics.
- If SHIB breaks above the 50 EMA resistance zone, it could see an 8-12% price expansion as momentum increases.
- Failure to break out could result in a triangle breakdown and a retest of recent lows, reversing the bullish outlook.
The Shiba Inu (SHIB) market is entering a critical phase as the price consolidates within a symmetrical triangle pattern, signaling a possible impending breakout. This tight structure, forming after a prolonged downward trend, indicates that market participants are beginning to hesitate. Sellers have shown signs of fatigue, while buyers are increasingly stepping in at higher price levels. The triangle suggests a shift in momentum, although the overhead selling pressure remains present.
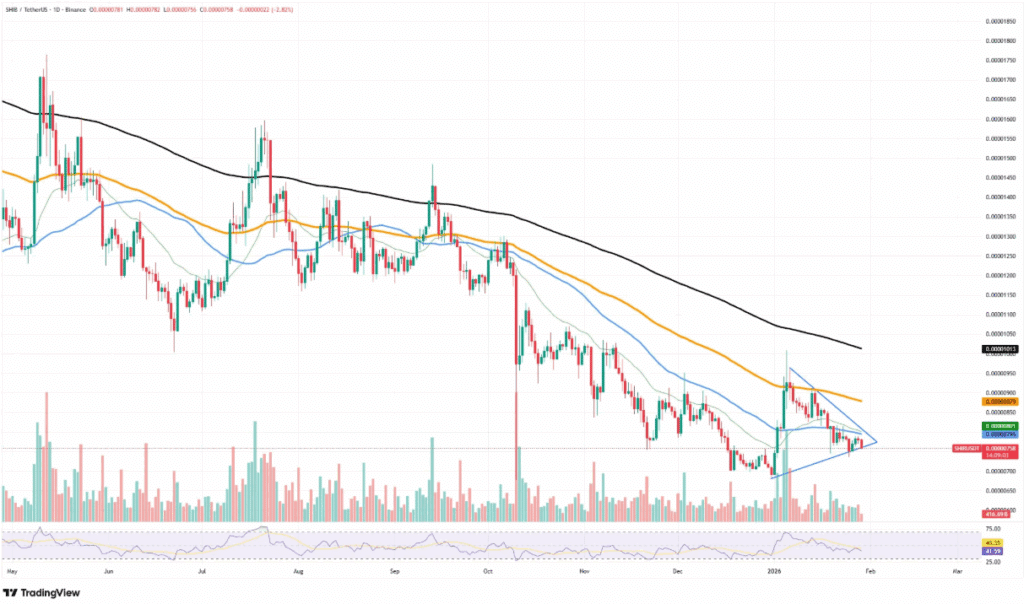
Shiba Inu’s recent price action has been notably calm, trapped within converging trendlines and contracting candle bodies. This type of chart formation, known as a symmetrical triangle, typically signifies a period of consolidation before a major price move. Historically, breakouts from such structures tend to be sharp and volatile. Given the compression of price action, the market is building energy, with liquidity likely to trigger a strong directional move once the apex of the triangle is reached.
Support and Resistance Levels to Watch for SHIB
As the price nears the apex of the triangle, the upper boundary coincides with the short-term moving averages, including the 50 EMA. A breakout above this level would bring SHIB into its first major resistance zone. If the bulls can clear this zone with significant volume, the next potential target is near the 100 EMA, a level consistent with previous breakdown points. A successful breakout could lead to a price expansion of 8-12%, depending on the strength of the momentum.
On the flip side, failure to break above the resistance level would invalidate the bullish compression scenario. If the price fails to hold, a breakdown of the triangle could lead to a retest of the recent local lows. In this case, the optimistic bias would shift, and SHIB might revisit lower levels, reversing the bullish outlook.
Indicators Suggest Strong Upside Potential
While the market remains indecisive, key indicators like the Relative Strength Index (RSI) point toward decreasing selling pressure, supporting the thesis of a potential bullish breakout. Sellers are showing diminishing strength with each attempt to push the price lower, while buyers seem to be more active earlier in the move, indicating an evolving market structure.
However, it remains crucial for traders to wait for confirmation before entering a position, as breakout strategies tend to be more successful than entering positions within the triangle.