
- SHIB’s breakout from a falling wedge signals a potential 422% rally, targeting $0.00008841 if bullish momentum sustains.
- The order block at $0.00001579 acts as key support, keeping SHIB’s upward trend intact while resistance levels may test further gains.
- Historical patterns and liquidity accumulation support a bullish breakout, aligning with past price surges after similar consolidations.
Analyst Javon marks show Shiba Inu (SHIB) breaking out of a falling wedge pattern, signaling a potential rally. The breakout could lead to a price increase of over 422%, targeting $0.00008841. Historically, similar patterns have resulted in strong bullish moves.
There is a phase of accumulation with lower lows and lower highs prior to the price movement’s breakout. Thus, SHIB may be in for a major bullish trend towards new all-time highs if momentum continues.
SHIB Market Structure and Trend Analysis
Before creating a collapsing wedge, SHIB’s price movement displays an upward surge. Two downward-sloping trendlines make up the pattern, with the upper trendline falling at a sharper angle. Prior to a breakout, price consolidation within this wedge has reduced volatility. This pattern’s existence indicates a bullish continuation that is consistent with previous market moves.
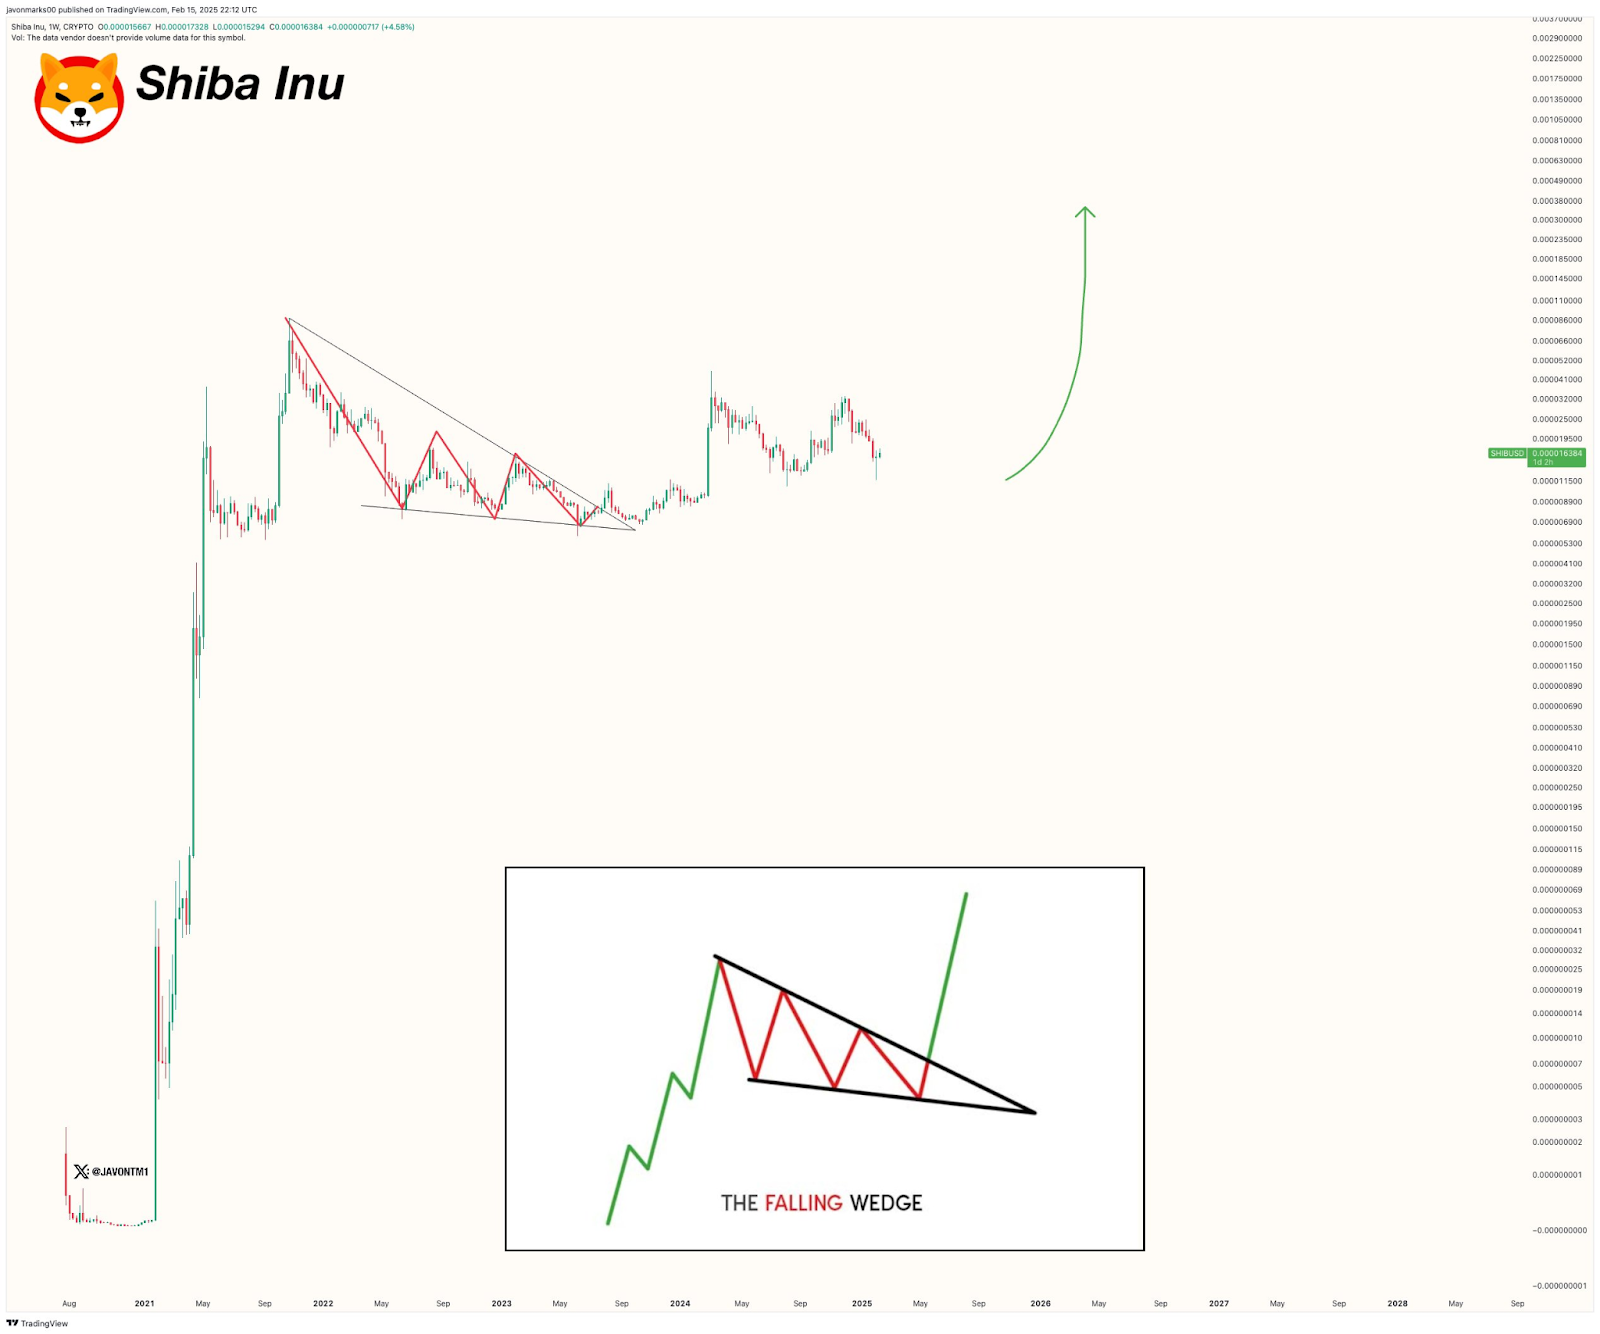
Besides, an inset diagram in the analysis visually confirms the falling wedge structure. The displayed historical price data with a major breakout occurs after prolonged consolidation. Moreover, a green arrow projects potential future price movement, reinforcing bullish expectations. The breakout pattern is consistent with past bullish trends.
Current SHIB/USDT Price Action
On the four-hour SHIB/USDT data, Trader Mario shows the price forms higher lows, confirming an ascending trendline. With a support order block (OB) of $0.00001579, the price is presently trading at about $0.00001662. This area has been essential in maintaining the upward trend and averting drops. SHIB might keep moving higher if this level holds.
Resistance points at $0.00001739, $0.00001815, $0.00001894, and $0.00001986 represent probable areas of price reaction where increased selling pressure might be present. If SHIB is able to break through these barriers, an even stronger rally might follow.
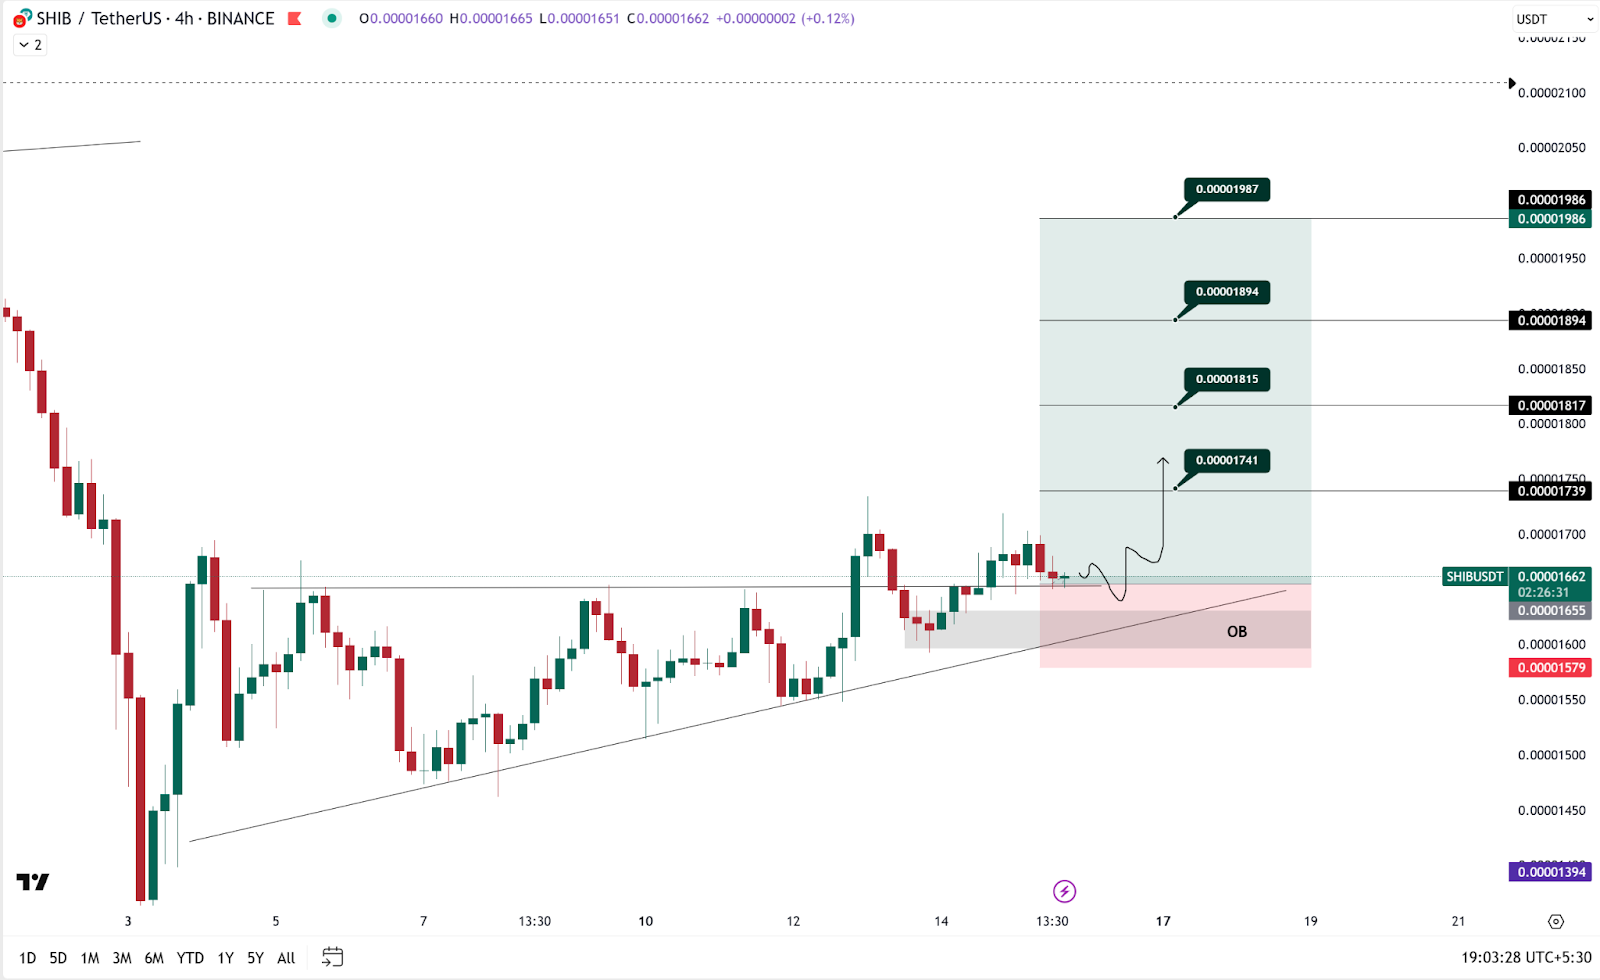
The market structure shows bullish momentum, with higher highs and consistent trendline bounces. The shaded liquidity area highlights price accumulation, supporting the breakout case. Hence, maintaining the order block level could reinforce bullish sentiment.