
- SHIB advances toward resistance after higher lows are formed, while derivatives activity increases across several major cryptocurrency exchanges.
- Derivatives data shows MEXC leading open interest, LBank leading volume, and OKX recording the highest futures trade count.
- Recent market data lists SHIB at $0.055923, with gains of 3.32% daily and 15.78% over seven days.
SHIB price action continues to test resistance after a sustained recovery, while derivatives activity shows renewed participation across exchanges and stronger market turnover.
Price Structure Advances Toward Key Resistance
$SHIB KNIGHT recently stated that “SHIB is reaching the targets,” as price approached $0.0000060. The accompanying chart shows accumulation developing around the $0.0000055 region. Several small candles formed as buyers defended the lower trading range.
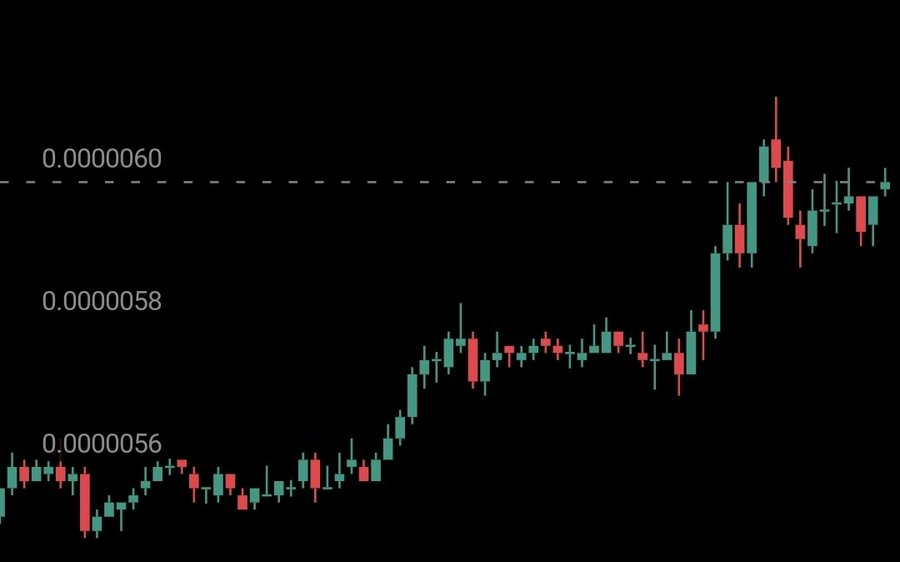
Price then moved above $0.0000056 before reaching the $0.0000057 region. The advance strengthened after resistance near $0.0000057 gave way. Several bullish candles subsequently carried the market toward $0.0000058.
The next major reference appeared around the $0.0000060 level. Price repeatedly approached this area while maintaining most recent gains. However, an initial rejection produced a noticeable upper wick.
Following that rejection, the price stabilized above approximately $0.00000585. Subsequent candles formed a narrower range beneath the resistance level. This keeps $0.0000058 relevant as nearby support for the current structure.
Market Activity Shows Renewed Derivatives Participation
The supplied market data as of writing lists SHIB at $0.055923. It also records a 3.32% daily increase and 15.78% weekly gain. Reported 24-hour trading volume stands at approximately $254.19 million.
The derivatives chart shows changing activity from late March through September. April and May generally displayed smaller daily bars across the period. Activity increased through several concentrated spikes during late May and June.
The strongest displayed movement appeared around late July. Large green and red bars formed during that period of heightened activity. Another substantial activity burst appeared around late August afterward.
The yellow line later recovered from its July lows. It fluctuated during August and September before rising sharply near September’s end. The latest reading therefore shows increased activity compared with earlier summer levels.
Exchange Metrics Reveal Different Participation Patterns
MEXC records the largest displayed open interest at $27.23 million. Bitget follows with $11.74 million, while LBank reaches $10.68 million. OKX, Gate, and KuCoin recorded $8.68 million, $6.96 million, and $4.69 million.
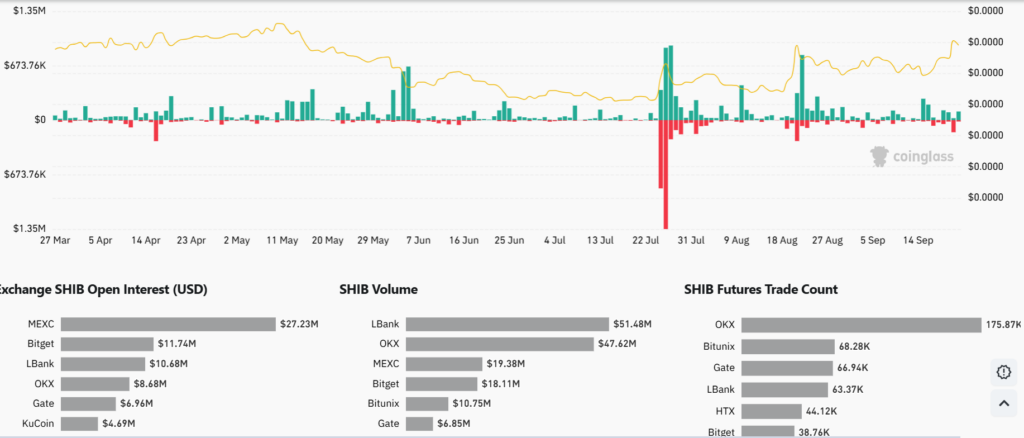
Trading volume produces a different exchange ranking across the displayed data. LBank leads with $51.48 million, followed closely by OKX at $47.62 million. MEXC records $19.38 million, while Bitget reaches $18.11 million.
Futures trade counts also show OKX leading the displayed exchanges. OKX records approximately 175.87K trades, ahead of Bitunix at 68.28K. Gate follows with 66.94K, while LBank records approximately 63.37K trades.
The exchange figures show different leaders across open interest, volume, and trade counts. Meanwhile, the $0.0000060 level remains the key resistance on the chart. The $0.0000058 area remains important if another pullback develops.