
- Bitcoin’s green September historically precedes double digit October gains, according to IncomeSharks.
- Price stability between $100K support and $120K resistance defines the key decision zone for October.
- Binance netflow of -311 BTC, noted by Umair Crypto, aligns with past accumulation phases before upward moves.
Bitcoin’s latest monthly performance has drawn renewed attention after closing September with a 5.65% gain. That outcome has led to historical comparisons. According to analyst IncomeSharks, “In all of Bitcoin’s history if it’s closed the month of September green it’s had a double digit month in October.” This places increased focus on October’s movement, especially as price trades just below the $120,000 level.
Historical Cycles Align With Current Outlook
Previous market cycles show a pattern of sharp expansions followed by deep retracements. Between 2016 and late 2017, Bitcoin rallied to nearly $20,000 before correcting below $4,000 through 2018.
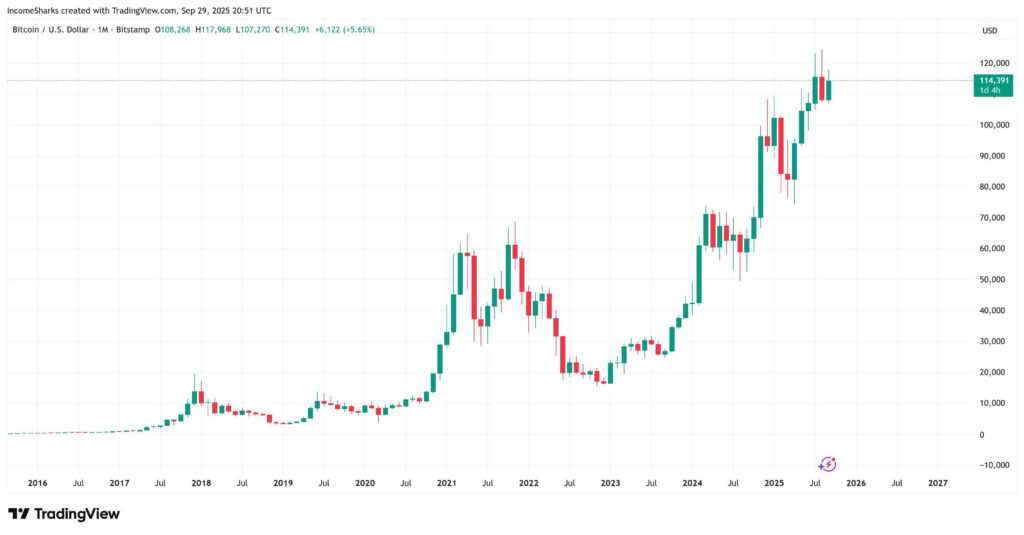
A fresh uptrend took shape in late 2020, reaching $69,000 by late 2021, then unwinding again into 2022 with lows near $16,000–17,000. The structure since early 2023 has produced consistent higher highs and higher lows, confirming sustained strength rather than exhaustion.
That outlook places the current range within a broader macro uptrend. Resistance is firm near $120,000, while support has formed in the $100,000 region. Maintaining that platform has supported Bitcoin’s stability at six figure levels, establishing a potential launchpad for higher targets.

Analyst Flow Data
On-chain movement appears to support the bullish stance. Umair Crypto reported, “BTC Binance Netflow at -311 BTC. Historically, this signal has often appeared right before upward trends, acting as a potential ‘buy signal’ for traders.” Reduced exchange supply typically coincides with reduced selling pressure. While not a guarantee of continuation, the timing aligns closely with September’s confirmed strength.
Furthermore, recent price behaviour suggests consolidation rather than reversal. The monthly candlestick opened at $108,268, dipped only to $107,270, then pushed toward $117,968 before closing near the upper range. That positioning indicates buyers retained control despite intermittent volatility.
Key Levels for October
Attention has now changed toward the immediate breakout zone. A decisive move above $120,000 could lead toward $150,000–160,000, based on previous extension patterns. However, slipping beneath $100,000 would change focus back to the $90,000–100,000 support area.
Until a resolution emerges, market outlook continues to support upward momentum supported by cyclical precedent. Both historical monthly performance and exchange flow data reinforcing that trend.