
- SEI trades at $0.1942, maintaining compression near the triangle base and key structural support zone.
- Fibonacci levels identify recovery targets at $0.33, $0.49, and $0.70 once resistance is successfully cleared.
- Current support zone signals a potential launchpad for a breakout as market volume begins to expand.
At the time of writing, SEI was trading at $0.1942, maintaining stability near a crucial structural base. The token’s price pattern shows extended compression within a descending triangle that may act as a launchpad for upward movement toward the $0.70 level once resistance is cleared.
Compression Builds as SEI Approaches a Key Breakout Zone
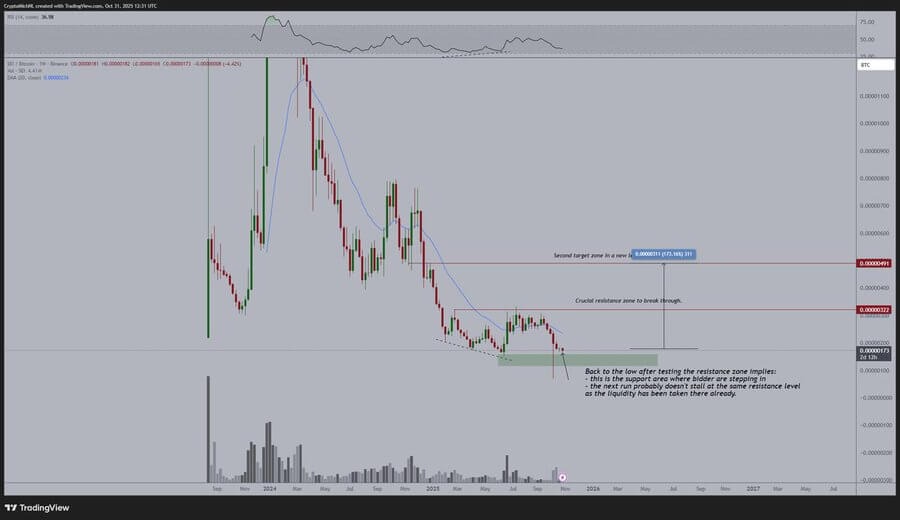
SEI has been forming a descending triangle since early 2024, according to an analysis prepared by Ali Charts. The price moved from above $1.10 down to the $0.18 zone, with each rebound producing lower highs under consistent downward resistance. Horizontal support has developed near $0.15, containing volatility and keeping SEI within a narrowing formation.
The chart’s x-axis serves as a consolidation area, showing multiple retests and holding prices above the support level. Technical data indicates that the compression phase often precedes expansion as trading activity tightens near structural convergence points. Fibonacci retracement levels identify potential recovery zones at $0.33, $0.49, and $0.70, with the 0.618 retracement around $0.49 acting as a mid-level resistance before the projected target.
Volume data reveals reduced activity, a condition that commonly occurs before price expansion. As SEI trades near its structural base, the potential for a technical breakout remains within scope, particularly if price action surpasses the descending trendline that defines the triangle’s upper boundary.
Analyst Outlook and Broader Market Context
According to market analyst Michaël van de Poppe, SEI has “returned to the higher timeframe support level,” describing it as “a great entry point” for traders. He added, “I would assume we’re going to be seeing a new run from here.” His analysis indicates that the current area could serve as the beginning of a recovery phase.
Broader market data show that SEI’s current decline aligns with a wider correction across the cryptocurrency sector. Despite these conditions, trading interest remains supported by ecosystem developments and ongoing network upgrades.
As SEI nears the triangle’s x-axis, this region may serve as a foundation for renewed bullish momentum, with analysts identifying $0.70 as a possible target once resistance breaks and market volume begins to expand.