
- SEI forms a strong weekly candle as early uptrend signs appear above key support levels.
- Price holds near $0.13 while the weekly chart shows higher lows despite short-term declines.
- Derivatives data shows rising volume and long liquidations as network activity continues to grow.
SEI records early progress on the weekly chart as the market forms steady movement above recent support levels. The latest candle shows controlled upward action, and strength builds after several compressed sessions. Early uptrends often begin slowly, and SEI now forms a structure that fits this pattern.
Price Conditions and Current Market Movements
The lower-timeframe chart shows a steady downtrend moving toward a support zone near $0.15. Price tests this level many times while forming lower highs across the session. As per Coingecko data, SEI trades near $0.1318 with a 14.6% daily decline. The range shows movement between $0.1286 and $0.1549 as the market records continued intraday swings.
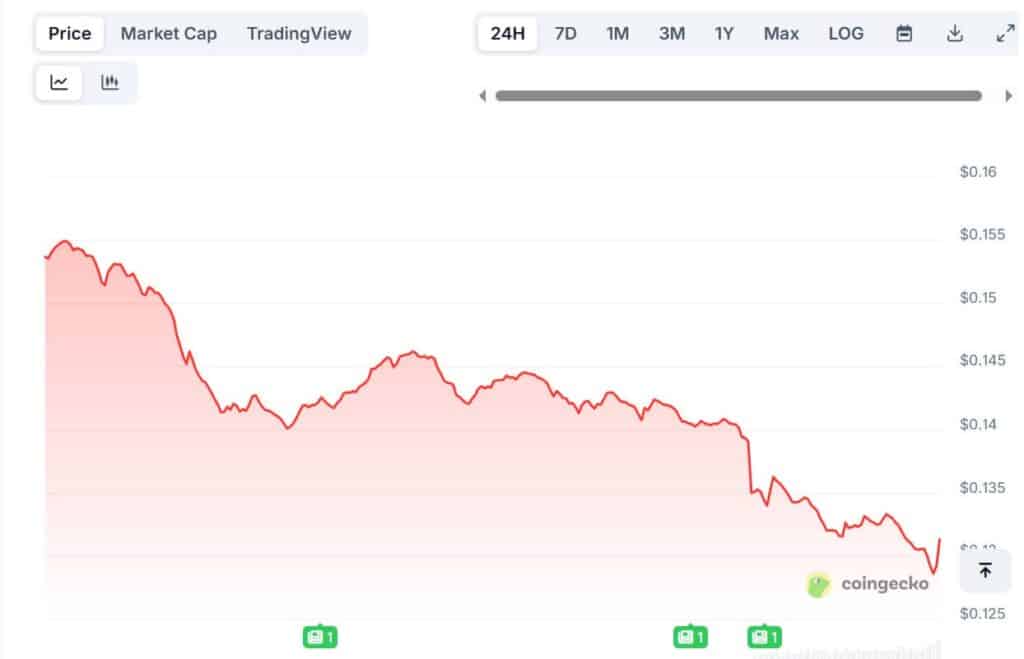
Market cap stands at $830.69 million, and the fully diluted valuation reaches $1.30 billion. Trading volume records $161.96 million, and activity stays firm across the session. The chart shows lower moves followed by small rebounds, yet the final candle forms a clear reaction near the $0.13 area. The moving average trends downward while the RSI remains below the midline.
The weekly structure presents a different picture. SEI forms higher lows and moves above earlier support levels. Van de Poppe stated, “Good start with a good weekly candle, and I would like to see follow-up in the coming weeks.” The candle forms a strong structure as volume increases during the latest move.
Network Activity and Derivatives Market Behavior
The Sei network reports steady growth as new updates expand performance. Development activity increases during recent months, and usage from new applications grows. These updates coincide with stable transaction trends and continued ecosystem activity.
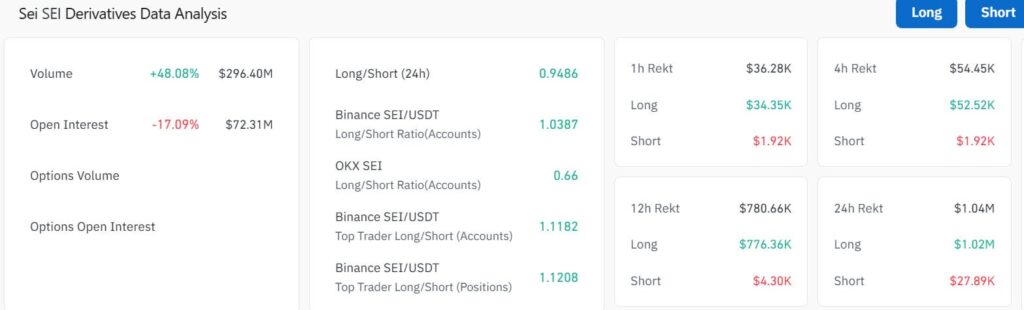
Coinglass data shows rising derivatives engagement. Trading volume climbs 48.08% to $296.40 million, while open interest drops 17.09% to $72.31 million. Liquidations favor long positions across all periods, and the 24-hour total reaches $1.04 million.
Top trader positioning shows stronger long exposure on major exchanges, and order flow remains active across the market. SEI now records early progress across both weekly structure and network activity, and traders watch upcoming candles for continuation.