
- SEI holds near the 0.382 Fibonacci level, with $0.29 acting as the immediate support boundary.
- Analyst Ali predicts a 200% rise toward $1.15 if SEI clears resistance between $0.38 and $0.52.
- Trader Muro notes rising spot entry interest, citing active development and defined stop zones.
SEI is drawing renewed attention after multiple analysts flagged an early breakout setup that could change into a long term trend reversal. Analyst Ali described the current structure as “still early to load,” noting that his calculated breakout framework points toward $1.15.

That level is a projected 200% rise from current pricing. His outlook aligns with technical signals forming across higher time frames, where price action has stabilized around a Fibonacci retracement cluster that often precedes directional momentum.
Recovery Zones
Price is near the 0.382 Fibonacci retracement level at $0.29388, establishing a short term pivot point. Notably, lower support is at the 0.236 zone near $0.21772. However, price stability above $0.29 acts as the immediate reference area.
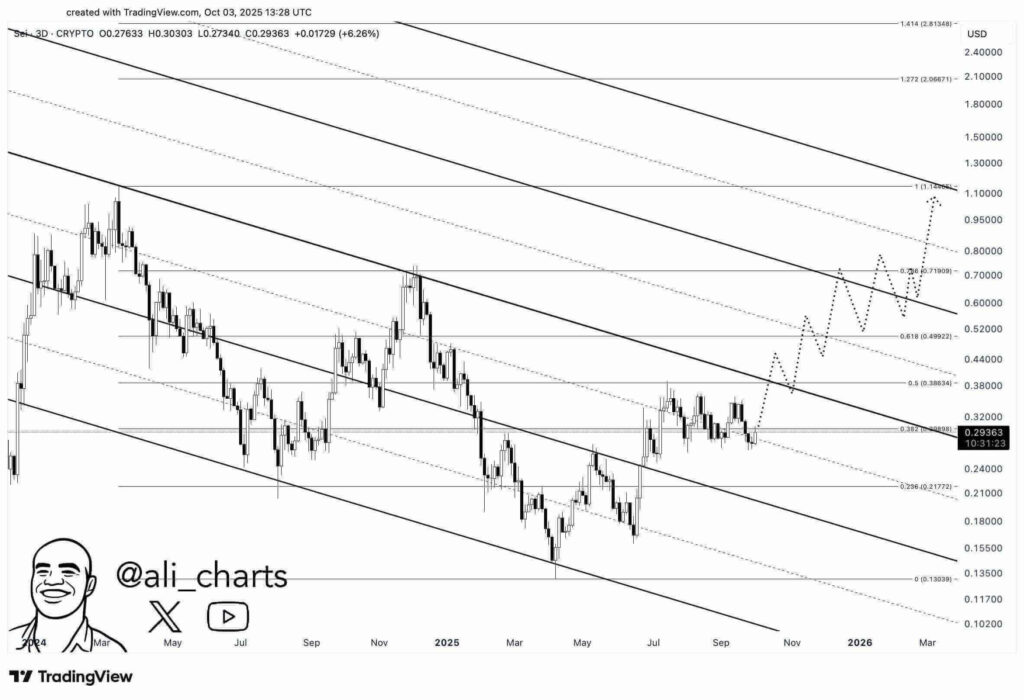
The next confirmation layer is between $0.38634 and $0.49922, aligned with the 0.5 and 0.618 retracement levels. A move through that pocket would also align with analyst Ali’s outlook for acceleration toward $1.15.
Historical Trend Channels
The asset is confined within a downward parallel channel that has influenced price behavior over several months. However, projection paths drawn through the model suggest a staircase style pattern rather than a direct rally.
That formation shows incremental recovery attempts, beginning with a climb toward $0.38–$0.52. Should momentum build from there, historical reactions to similar setups place $0.71099 and $1.1761 as progressive checkpoints. Long term Fibonacci extensions further project $2.0667 and $2.8135 as higher range possibilities if price maintains upward pressure.
Spot Entry Interest
Trader Muro noted accumulating sentiment, stating that SEI currently “looks fantastic for a spot swing long.” He added that short term entries could be attempted with defined stop placements, stressing that the development team behind the project remains active across deployments.
That observation supports the idea that price stabilization near current levels indicates accumulation rather than exhaustion. Failure to maintain $0.29, however, would reintroduce $0.21 and $0.13 as fallback regions based on previous structure tests.
The overarching movement now depends on sustained footing near the 0.382 support band. Each resistance band above corresponds with clearly defined Fibonacci checkpoints rather than speculative targets, creating a structured outlook rather than an undefined rally window.