
- SAND remains near a long-term wedge base while short-term charts show steady but controlled selling pressure.
- Liquidation data reflects repeated long position flushes, signaling leverage reduction rather than trend confirmation.
- The $0.128–$0.132 range continues to define near-term direction and trader positioning.
SAND is trading at a technically sensitive level as long-term chart structures intersect with short-term downside pressure. Market participants are balancing signs of structural stabilization against ongoing weakness visible on lower timeframes.
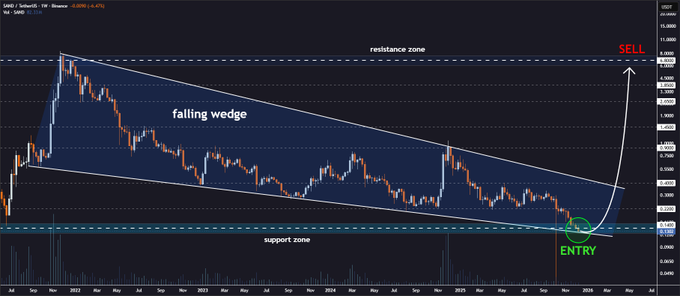
Weekly Structure Maintains a Constructive Technical Bias
The weekly chart places SAND near the lower boundary of a prolonged falling wedge formation. This structure has developed through compressed lower highs and gradually weakening downside momentum. Analyst Jonathan Carter referenced this setup in a recent post, pointing to its maturity.
Source: via X
Price action within the wedge reflects diminishing bearish strength rather than aggressive selling. Each successive decline has failed to extend meaningfully lower. Weekly closes continue to respect the wedge support, keeping the broader structure intact.
Historical reactions at this level show consistent buying responses. Volume activity tends to expand when price tests this zone, suggesting accumulation behavior. Carter outlined staged recovery levels beginning near $0.22, conditional on confirmation and sustained demand.
Liquidation Data Shows Persistent Long-Side Stress
The 12-hour liquidation chart indicates that long liquidations were always more than short ones. This indicates that traders have maintained a bullish bias using leverage. As price weakens, these positions are repeatedly forced out.
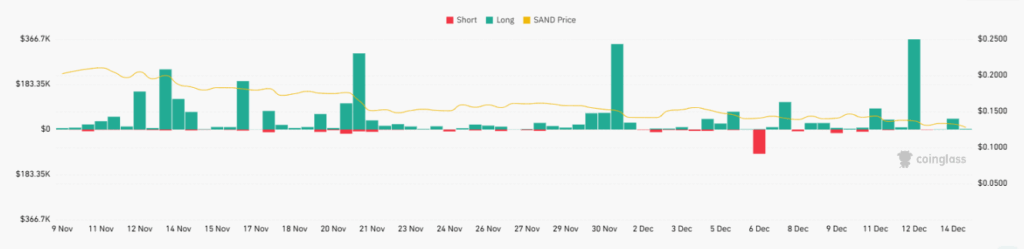
Between mid and late November, SAND declined from the $0.20 region toward $0.15. Several long liquidation spikes aligned with short-term pullbacks. Short liquidations remained limited, signaling that bearish positioning was not crowded.
In early December, a brief short liquidation event appeared during a minor bounce. Price failed to follow through, keeping the move corrective. A large long liquidation spike near December 12 reflected leverage capitulation without immediate recovery.
Short-Term Charts Reflect Cautious Market Behavior
SAND in the 24-hour chart, dropped out of the $0.133 level to about $0.128. The 3.61 percent decline was gradual pointing to disciplined selling. The absence of sharp volume expansion suggests no panic conditions.