
- RSR approaches the $0.006000 resistance level, signaling a potential breakout after consolidating in an ascending triangle pattern.
- The potential Golden Cross in RSR’s moving averages signals a bullish shift as the 50-day MA crosses above the 200-day MA.
- If volume remains strong, RSR may break above resistance, while low volume risks a pullback to support zones around $0.003600 or lower.
RSR (Reserve Rights) is showing the possibility of a bullish continuation after regaining momentum from a key support level of $0.004800. The price has been consolidating in an ascending triangle formation, raising hopes of an upward breakout.

As RSR approaches the resistance level, eyes will be on whether the cryptocurrency will push past or fall back to previous lows. However, if momentum weakens, a potential dip to a lower demand zone around $0.003300 could occur, offering another rebound opportunity.
Price Movement and Trendlines
The first chart highlights a descending triangle pattern on RSR’s 1-day price movement against USDT. The pattern features a series of lower highs and a horizontal support line, indicating a potential bearish continuation.
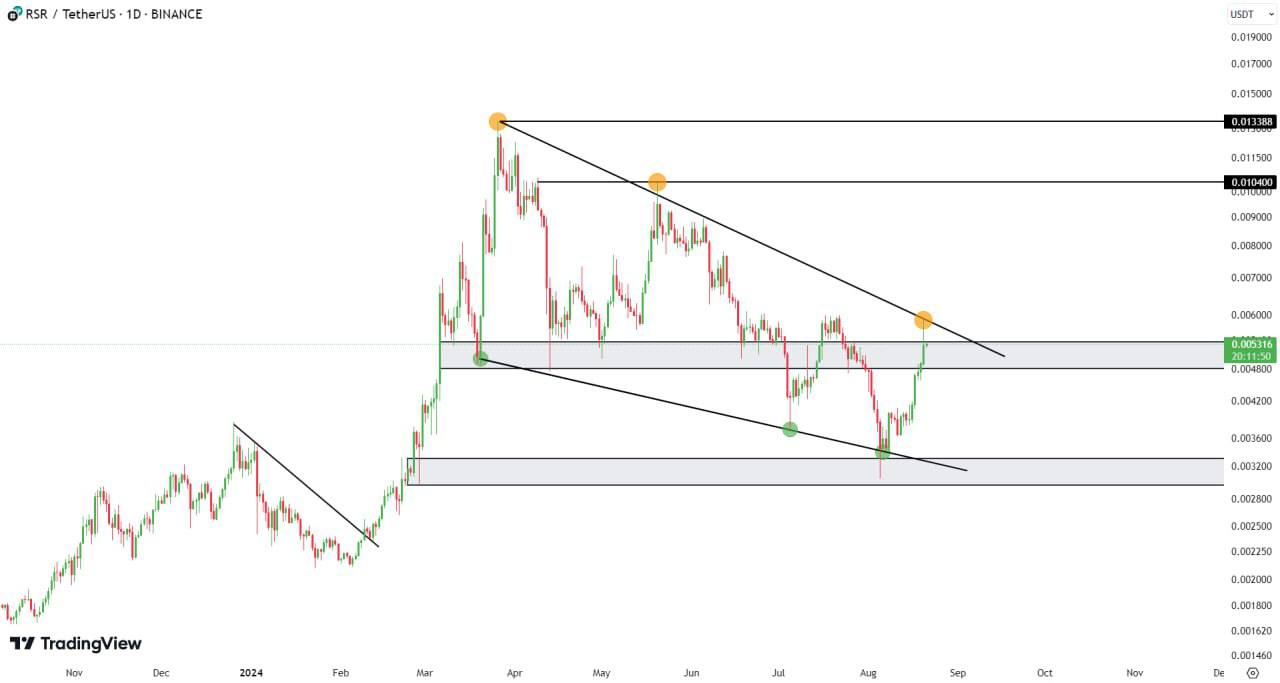
However, the chart shows that the price is currently testing the upper boundary of this triangle near the $0.006000 resistance level. The next move will be crucial, either RSR breaks out and heads toward targets of $0.010400 and $0.013388, or it faces rejection, leading to a potential pullback to support zones at $0.003600 and $0.002800.
This price movement has been accompanied by a steady interaction with descending trendlines connecting both lower highs and lower lows. RSR’s recent rally towards the upper trendline suggests that a critical decision point is nearing, one that could shape the cryptocurrency’s near-term trajectory.
Volume and Market Momentum
The price has been on a positive momentum. An increase in volume at these levels would signal a strong bullish reversal if RSR manages to break above the $0.006000 resistance. However, a lack of volume could signal the continuation of the descending triangle, bringing the cryptocurrency back to test lower support levels.
This volume-driven analysis underlines the significance of RSR’s recent movements. A strong push above resistance could solidify the bullish outlook, while failure to do so may result in a downward trend.
Moving Averages and Potential Golden Cross
In the second chart, key moving averages, highlight the potential for a Golden Cross. The 50-day moving average recently moved above the 200-day moving average, a bullish indicator.
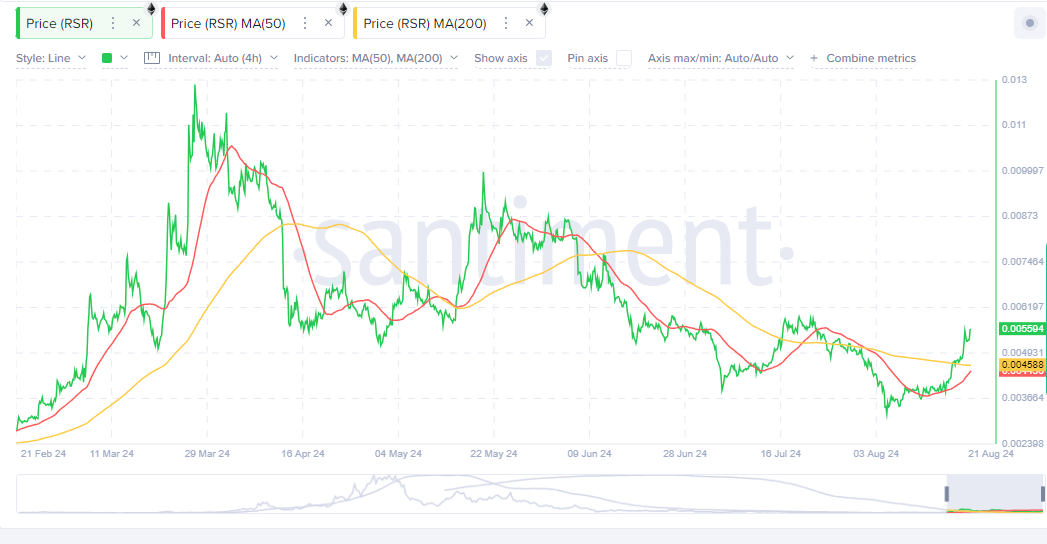 Source: Santiment
This crossover signals a potential shift from the previously bearish trend, with RSR’s price now above both moving averages. Support remains strong around $0.0034, while the next resistance level sits at $0.0062.
This bullish momentum has been supported by a noticeable increase in volume, indicating strong buying interest. However, if the price fails to sustain this upward trajectory, a pullback could test the $0.0034 support level. The potential for further upward movement remains intact, as long as volume continues to support the breakout.