
- Daily ROSE chart forms a descending wedge with higher lows, indicating compression and potential breakout toward $0.07–$0.08 resistance.
- The 4-hour chart shows MA(7) crossing MA(100) and RSI indicators trending bullishly upward .
- 24-hour market-cap rose from $130M to near $160M, displaying strong mid-morning gains and overall upward market trend.
ROSE has shown a notable technical setup suggesting a possible upward move. The long-term descending wedge indicates price compression and early bullish signs. Traders are monitoring key levels as market activity signals increased interest.
Technical Patterns on the Daily Chart
The ROSE/USDT daily chart reflects a descending wedge that has been forming for nearly a year. The wedge’s upper trendline descends from previous highs, while the lower line rises from multiple capitulation points.
This pattern represents a gradual reduction in price volatility.Recent candles show ROSE attempting to break above the wedge but retracing to retest its boundary.
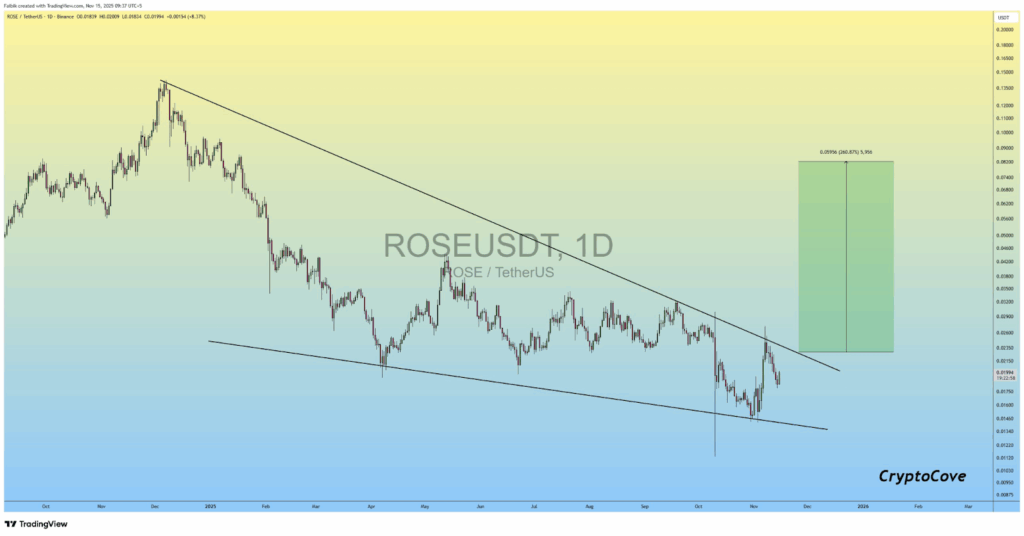
The projected upside zone ranges from $0.07 to $0.08, aligning with the gradient background on the chart. Moves from blue at the lows to yellow near the target are reflecting a shift in market sentiment.
Short-Term Momentum on the 4-Hour Chart
The 4-hour ROSE/USDT chart displays a narrowing falling wedge forming after a controlled downtrend. Price recently bounced from the lower boundary and is pressing near the $0.0200 resistance zone.
Moving averages indicate improving momentum. The MA(7) has crossed above the MA(100), signaling bullish strength, while ROSE has reclaimed the MA(200) , a dynamic support.
The MA(50) which sits just above the current price is acting as the next resistance level. Momentum indicators are pointed upward, with RSI(6) around 61 and both RSI(12) and RSI(24) rising from mid-range levels. The MACD histogram has also started showing green.
The signal lines are nearing a bullish crossover and volume has slightly increased suggesting growing buying interest.
Market-Cap Movements Reflect Daily Volatility
The 24-hour market-cap chart ranges from $130M to $160M, displaying volatility within an overall upward trend.
Profit-taking appears evident in the following pullback.During early morning hours, the market stabilized in a sideways pattern, reflecting equilibrium between buyers and sellers.
A strong upward momentum occurred around 07:00, pushing the market-cap close to $160M.The correction after this peak was gradual, ending near $148–150M.
The movement demonstrates a volatile but ultimately bullish 24-hour cycle, consistent with trader sentiment and trading activity.