
- $RAY drops 28% as Pump.fun’s AMM launch shakes Solana’s DeFi scene, testing key support at $2.77 amid strong selling pressure.
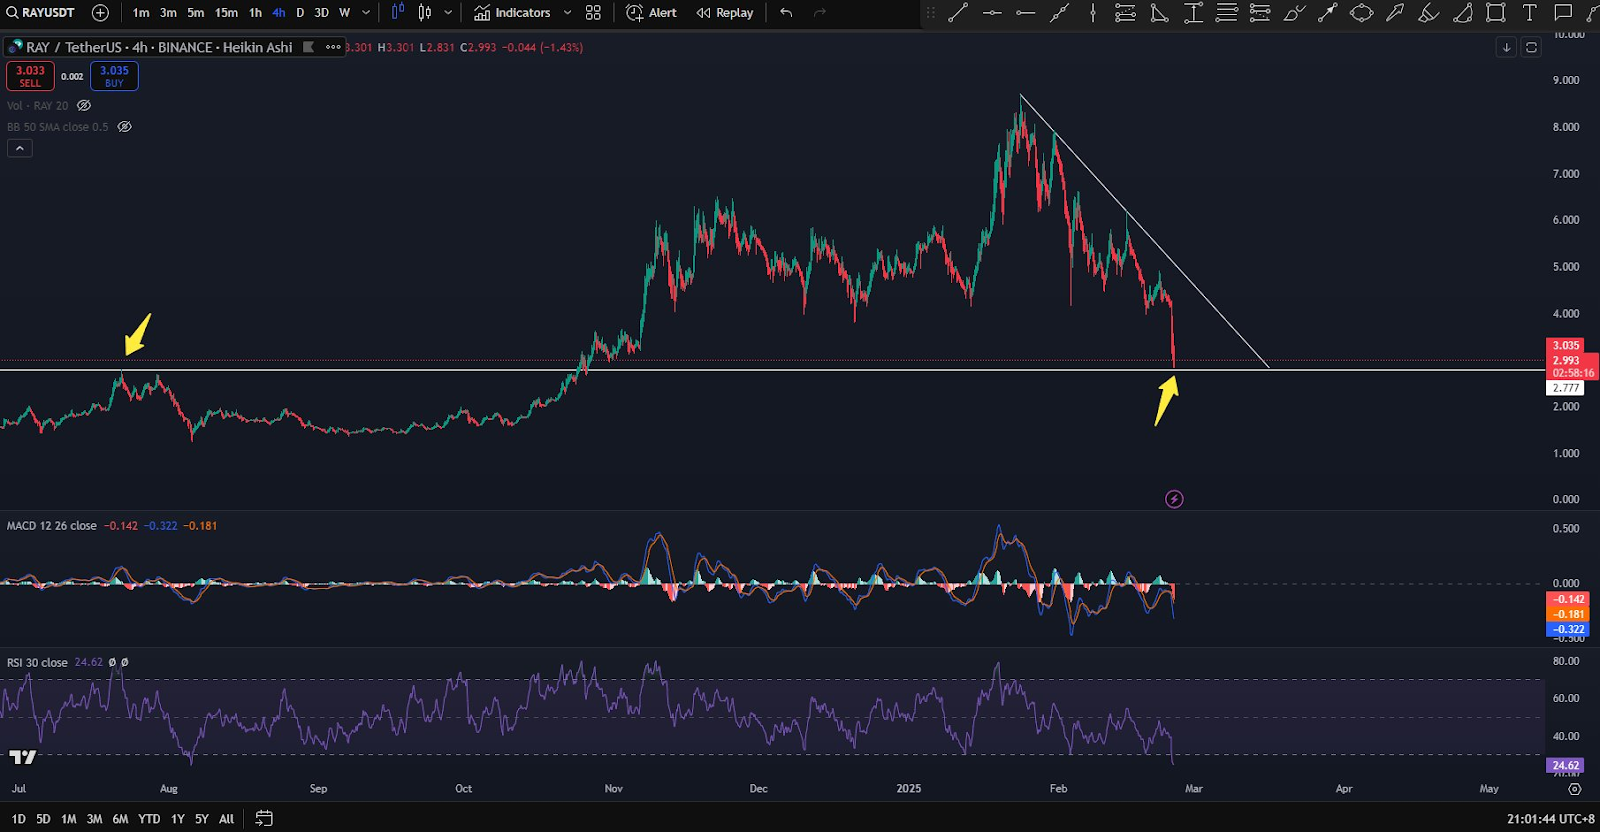
- RSI at 24.62 signals oversold conditions, hinting at a short-term bounce, but MACD remains bearish, confirming continued downside risk.
- Critical support at $1.573 is key—holding could spark a rebound to $3.285, but a breakdown may trigger deeper losses.
The Raydium Protocol ($RAY) token has suffered a sharp 28% drop, reacting to the launch of Pump.fun’s new AMM on Solana. This development poses a serious challenge to Raydium’s dominance, sparking a wave of sell-offs. Consequently, $RAY has crashed to a key support level, coinciding with its July 2024 high.
Technical Breakdown Signals Bearish Momentum
$RAY has broken through critical support, now testing long-term demand zones. At 24.62, the Relative Strength Index (RSI) is far into oversold territory. This implies that there might be a brief rebound. The MACD signal, which confirms selling pressure, is still negative, though. The price structure also keeps making lower highs and lower lows, which strengthens the downward trend.
A 4-hour chart shows the price hovering around $3.03, with a descending trendline reflecting continuous downside pressure. The recent drop has pushed the price towards the $2.77 horizontal support level, aligning with a past resistance zone. If buyers defend this level, a temporary rebound could follow. However, failing to hold this level could trigger further declines.
Critical Support at $1.573 – A Key Zone to Watch
Market analysts from Rose Premium Signals suggest waiting for a deeper retracement before entering any positions. Their analysis pinpoints $1.573 as a crucial support level. If price action rebounds from this area, traders might consider long positions with an initial target of $3.285. A stop loss below $1.573 would help minimize risks in case of extended bearish movement.
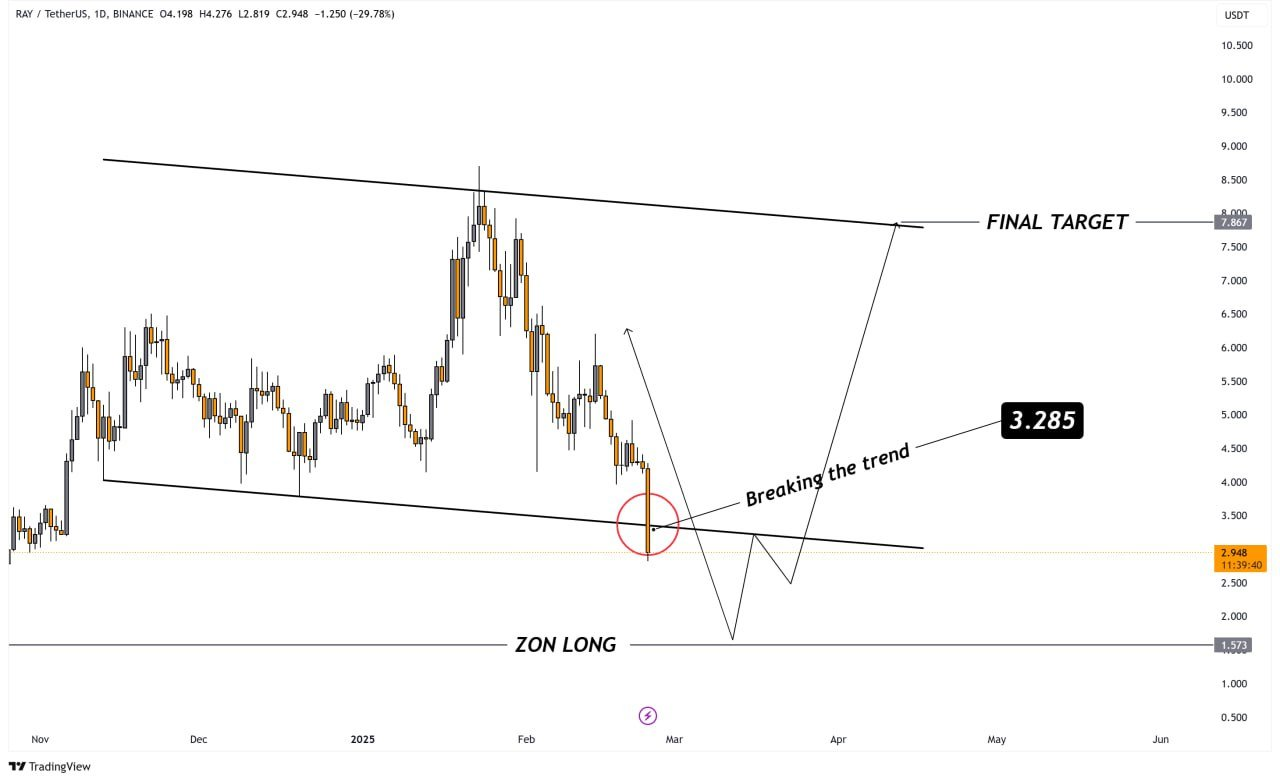
A daily chart reveals $RAY trading within a descending channel, testing its lower boundary. Historically, this zone has acted as a strong demand area. Additionally, candlestick wicks near this level indicate potential buying interest. If the price respects this support, a reversal toward $3.285 could emerge. However, if sellers break through $1.573, further downside pressure could send the token plummeting.