
- Analyst identifies $430 as major resistance, with a break potentially opening a path toward $2,000.
- QNT climbed from about $59 to $369 before correcting toward 220–240 and recovering above $300.
- RSI remained below 70, while MACD showed weakening momentum as QNT traded near $302.
Quant (QNT) has surged nearly 530% in two weeks, rising from approximately $59 to $369, according to analyst Ali Charts. The rally has brought the token toward a major resistance zone near $430, where a breakout could lead to further gains. However, QNT is now consolidating after its sharp advance, with its latest price near $302.
Ali Charts Identifies $430 as Major Resistance
Ali Charts said QNT could enter price discovery if it decisively breaks above the upper boundary of its channel near $430. The analyst identified $2,000 as a potential target following such a breakout, which could extend the token’s recent rally.
Meanwhile, the one-hour QNT/USDT chart shows a strong recovery from the 70–80 range. QNT began accelerating around September 26, moving above $120, $160, $200, and $240 before reaching approximately $370 on September 28.
The rapid advance was followed by a sharp correction toward 220–240. Buyers subsequently regained control, pushing QNT into a higher trading range around 280–320.
QNT Holds $300 as Momentum Indicators Diverge
QNT was trading at $301.820 on the latest one-hour chart. The candle opened at $301.572, reached a high of $306.523, and touched a low of $298.578. Trading volume stood at approximately 1.99K QNT.
The $320 level represents immediate resistance, while the previous peak around 360–370 remains an important upside reference. On the downside, $300 is a psychological support level, followed by $280 and $240.
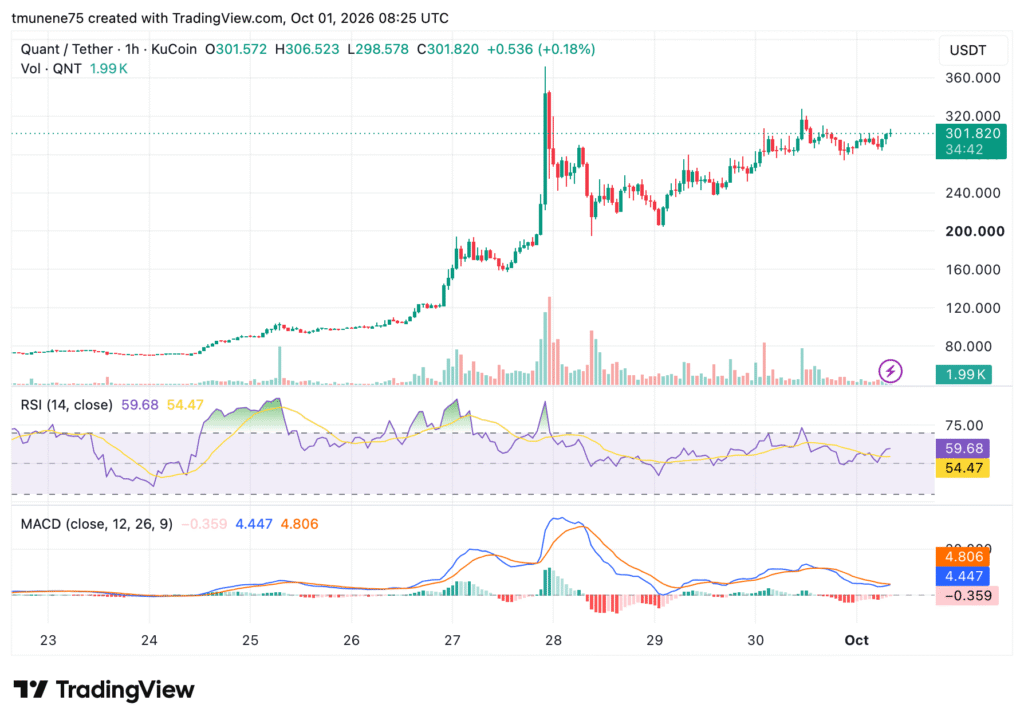
Momentum indicators show mixed conditions. The relative strength index (RSI) stood at 59.68, above its average of 54.47, remaining below the traditional overbought threshold of 70.
However, the moving average convergence divergence (MACD) showed weakening short-term momentum. The MACD line was at 4.447, below the 4.806 signal line, while its histogram registered -0.359.
Traders Watch $320 Breakout and Support Levels
A sustained move above $320 could bring the 360–370 region back into focus. However, a decline below $300 could expose support near $280, followed by $240. The latest candle closed at $301.820, while the chart recorded a 1.99K QNT volume reading.