
- PUMP showed a TD Sequential buy setup as reduced volatility and sustained selling pressure created the first clear signal of potential trend exhaustion.
- A strict rejection at the descending trendline maintained bearish structure, with measured moves indicating a possible continuation toward lower support levels.
- On-chain activity recorded more than $193 million in cumulative PUMP purchases, reflecting persistent accumulation despite reduced memecoin volume on Solana.
PUMP Price Analysis shows the token navigating a complex market structure as traders assess new technical signals and on-chain activity. The latest data suggests shifting momentum, though confirmation of direction remains uncertain.
Technical Signals Point to a Potential Market Shift
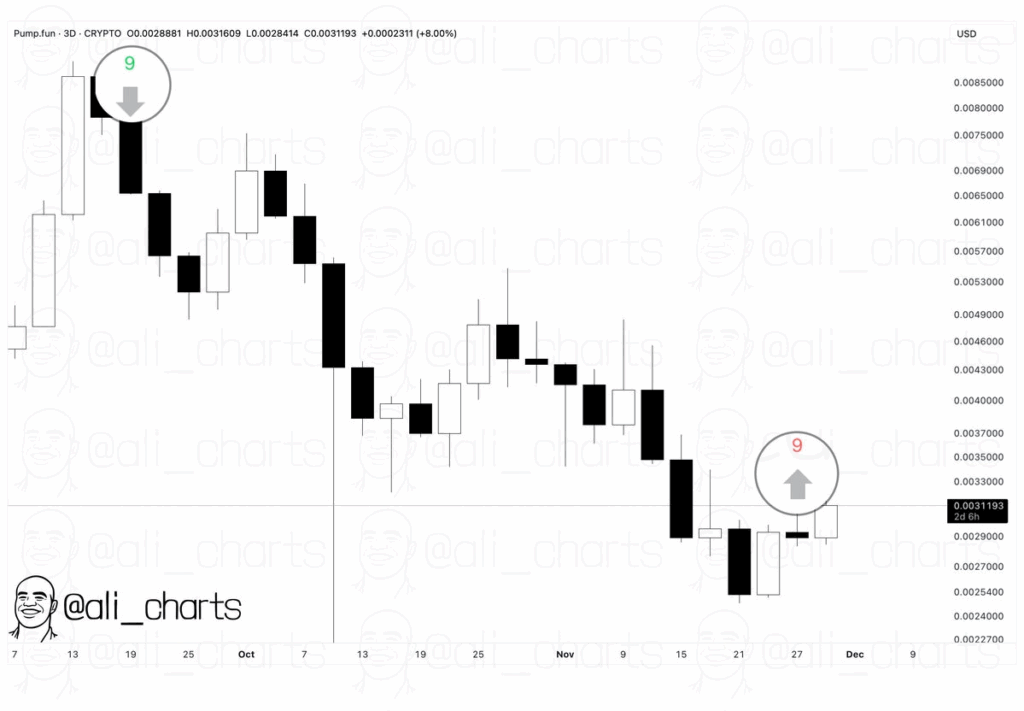
A detailed post from analyst Ali_charts noted that PUMP displayed a TD Sequential “9” buy signal after an extended downtrend. The earlier “9” sell signal marked the prior peak, and subsequent candles established a clear sequence of lower highs and lower lows.
This long period of weakness created the backdrop for the current setup.The new buy signal formed after sharp declines and a series of small-bodied candles.
These candles showed reduced volatility and suggested that traders may be reassessing short-term direction. Price hovered near $0.0031193 as the market attempted to stabilize above recent lows.
Although no confirmed reversal has formed, the technical structure shows that bearish momentum may be easing. The signal provides traders with a reference point as they evaluate a possible shift in sentiment after weeks of sustained selling pressure.
Trendline Rejection Maintains Bearish Structure
A separate daily chart of PUMP/USDT presented a strict rejection at a descending trendline. The failed attempt to break above resistance produced a strong red candle, indicating that sellers were still firmly positioned.
The trendline has acted as a consistent barrier during recent rallies.Two measured leg-down structures were identified, with the first marking a drop of about 33.7%.
A projected path suggested a potential continuation move of around 43%, reflecting symmetry between declines. These repeated breakdowns kept the market in a clear downward pattern.
The $0.0013–$0.0014 zone is an important level for traders and until price holds above the descending resistance, the broader setup continues to favor downward pressure.
On-Chain Activity Shows Large Token Accumulation
Market attention increased after data showed more than $1.08 million in new PUMP purchases in a single day. Accumulated buying surpassed $193 million, representing about 12.7% of the circulating supply over four months.
One post noted that this activity persisted even as memecoins held about 5% of Solana volume.A dashboard snapshot recorded 1,030,579 SOL in total PUMP purchases, placing the token within high-volume meme-market behavior.
With a total supply of one trillion tokens, reduced circulating supply created tighter liquidity conditions, which can influence volatility during fast market movements. Daily records also showed large token amounts generating steady yields, with efficiency readings near peak levels.