
- DOT nears key resistance; a breakout could push the price higher, while rejection may lead to a bearish retracement.
- RSI remains neutral; short-term EMAs trend up, but long-term stability suggests indecision in market momentum.
- Psychological resistance at $8.056 is critical; failure to break may give sellers control, with key supports at $4.570 and $3.541.
Polkadot (DOT) is testing a crucial resistance level after bouncing off its exponential moving averages (EMAs). The market remains undecided as traders await a clear breakout or rejection. Price action sits just below the resistance zone, creating anticipation for the next move. Two scenarios—Plan A and Plan B—outline potential outcomes based on market reactions at this key level.
Market Structure and Resistance Zone
The price of DOT has been on an upward trajectory, reaching a strong resistance zone marked in orange. A previous local top lies above this level, making it a critical point for determining future price action. The yellow trendline illustrates this recent bullish movement. However, a decisive break above the resistance has yet to occur, leaving room for a possible reversal.
If DOT fails to breach the resistance zone, a bearish retracement could follow. Plan A anticipates a rejection at this level, potentially sending prices down toward a support area near $3.541. Conversely, Plan B suggests a breakout above resistance, with the price reaching the local top before a possible downward correction. Traders are closely monitoring which scenario will unfold.
Technical Indicators and Key Levels
Several indicators provide insight into DOT’s current market behavior. The Relative Strength Index (RSI) remains neutral, indicating neither overbought nor oversold conditions. Moving averages present mixed signals, with short-term EMAs trending upward while long-term ones remain stable.
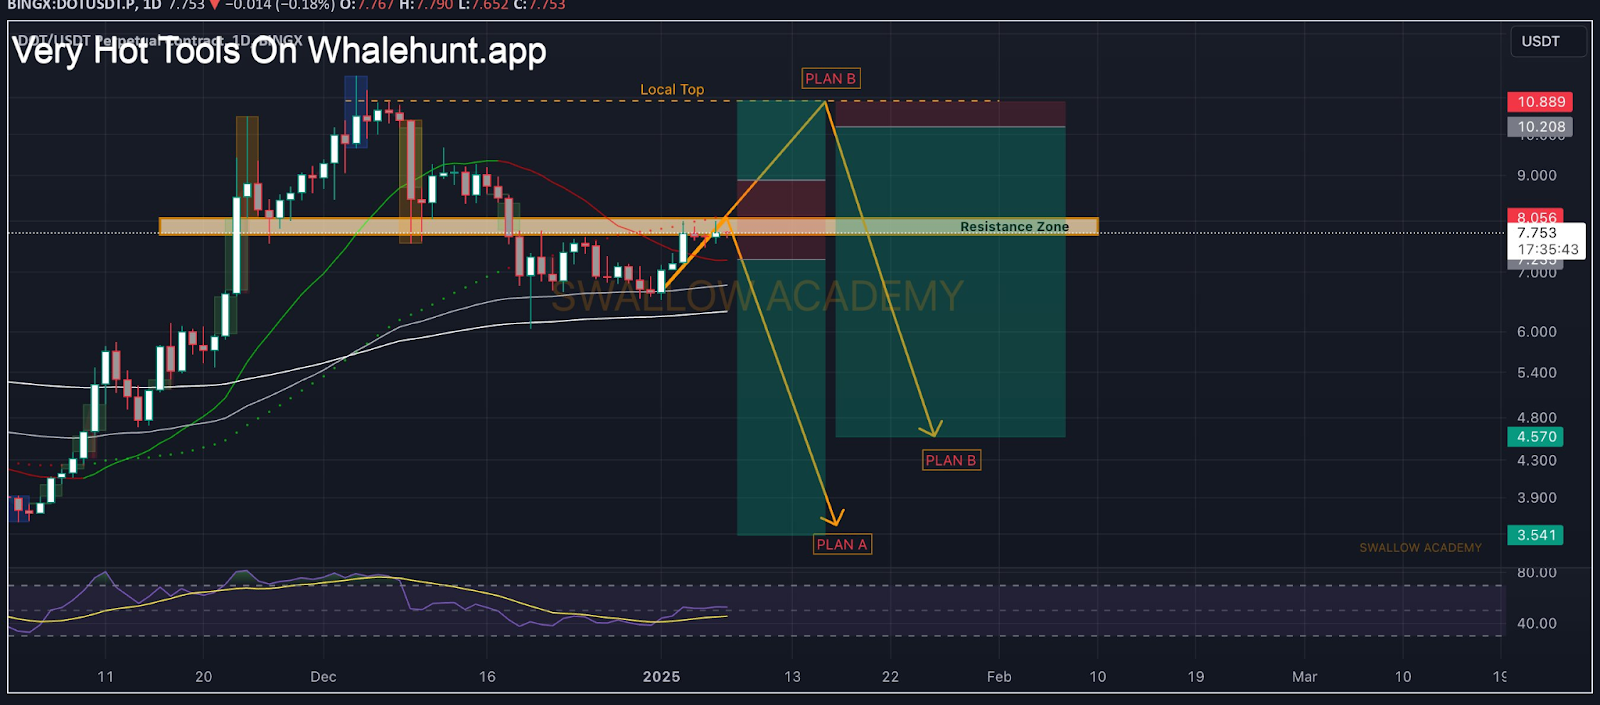
Psychological resistance near $8.056 remains a key barrier for bulls. If buyers fail to push beyond this level, sellers could regain control. Meanwhile, major support levels are identified around $4.570 and $3.541. A break below these supports could accelerate the decline.
The data incorporates a risk-reward framework, marking entry and exit points for bullish and bearish trades. Green zones highlight potential profit areas, while red zones indicate stop-loss placements. Traders should exercise caution as the market remains at a pivotal stage.