
- Over 5,000 new Polkadot accounts created within 24 hours signal heightened network interest and user engagement.
- Polkadot breaks above key $4.90 resistance, moving toward next resistance at $5.60 as bullish momentum gains pace.
- Volume surge, golden cross crossover, and strong support levels highlight a potential long-term bullish trend for Polkadot’s DOT.
Polkadot has witnessed a significant rise in new accounts over the past three days, with over 5,000 accounts created within the last 24 hours on its relay chain. This increase aligns with a notable shift in Polkadot’s market dynamics, characterized by key technical trends on the DOT/USDT pair. With the recent price action surpassing major resistance levels, Polkadot is gaining traction as bullish patterns emerge.
Major Breakout Sets Stage for Potential Trend Shift
Polkadot’s price recently broke out from a prolonged downward trend marked by descending trendlines. This breakout indicates a move from the bearish movement and suggests a potential upward trend.

Between mid-August and early November, DOT’s price consolidated within a range between $3.62 and $4.90, creating an accumulation phase with strong buying pressure at the lower boundary.
Additionally, a bullish reversal pattern, known as a falling wedge, took form within this consolidation zone. The breakout from this wedge aligns with DOT’s recent rally, which saw prices rise sharply from the previous $4.90 resistance to $5.60.
Price Levels Indicate Key Support and Resistance
Polkadot’s current price structure reveals major levels that could shape its movement. A critical support level lies at $3.62, the lowest point of the recent consolidation, while $4.90 now serves as support following the breakout.
The $5.60 level, Polkadot’s recent peak, acts as short-term resistance. If bullish momentum holds, further targets may lie at $7.50, a mid-term resistance, with a long-term potential target at $9.43. These levels serve as crucial indicators for tracking Polkadot’s progress and potential retracements, especially if prices test these support areas in a future pullback.
Volume, Moving Averages, and Market Momentum
Polkadot’s price rally coincides with a surge in trading volume, indicating strong buyer interest and supporting the breakout. The recent rise also triggered a golden cross event, where the 50-period moving average crossed above the 200-period moving average, a positive indicator of a potential shift toward an upward trend.
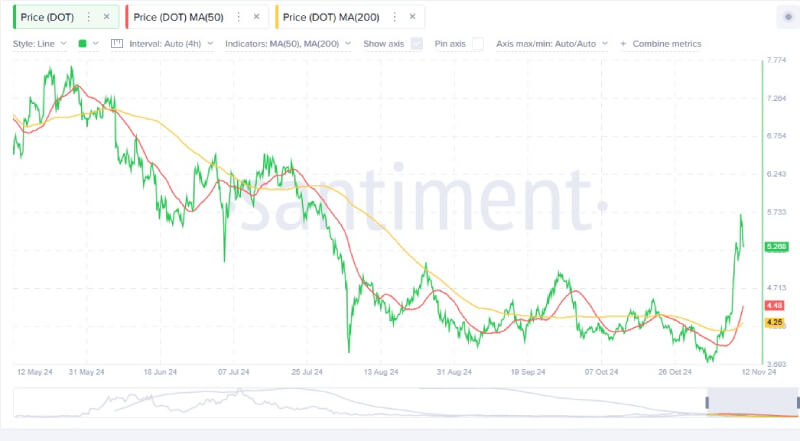
Meanwhile, resistance at $5.73 has held back further gains, making this level a key focus for near-term movement. If Polkadot can surpass this barrier, it may aim for higher targets around $7.26, aligning with previous highs.