
- Plasma’s XPL soared nearly 100% on launch but now faces resistance at $1.45 while traders eye $1.40 support for direction.
- XPL shows strong fundamentals with $5.7B TVL and $4.3B stables yet technicals warn of bearish divergence and lower highs.
- Despite explosive demand and heavy volume, XPL trades in a downward channel and consolidation near $1.40 shapes its next trend.
Plasma’s native token XPL is capturing major attention only one day after launch, with explosive growth across several metrics. According to CryptoRank.io, the chain already boasts $5.7 billion in TVL, ranking ninth among all blockchains.
Additionally, its stablecoin market cap stands at $4.3 billion, ranking seventh overall. Meanwhile, XPL surged nearly 50% from its initial $0.75 launch price, reaching highs near $1.45 before cooling.
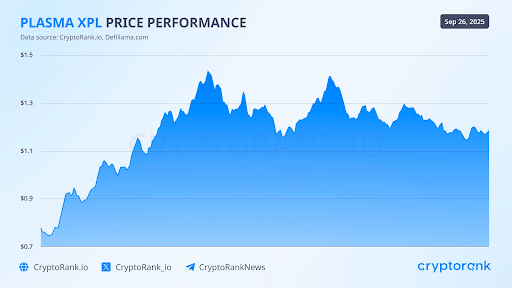
The chart from CryptoRank.io and Defillama shows dramatic volatility across the first trading sessions. Prices initially rallied from $0.75 to $1.45, almost doubling within hours. However, XPL met resistance near $1.42-$1.45 on two separate occasions, forming a clear double-top pattern. Consequently, the token corrected toward $1.20 support, signaling hesitation after the initial euphoric surge.
Price Action Shows Strong Volatility
XPL’s market activity highlights three major rally phases. The strongest occurred around 06:00 when prices surged to $1.60 before reversing. This spike represented the session’s most aggressive advance, but profit-taking soon pulled the price back. As a result, XPL ended the day at about $1.43, recording a slight gain of 0.69%.
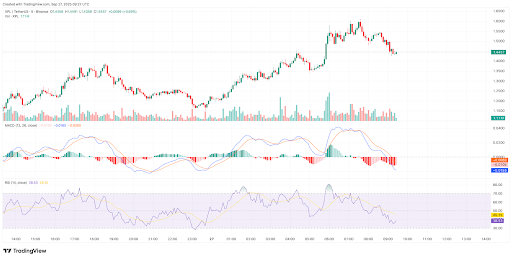
High market involvement was also supported by the trading volume, which increased to 1.11 million tokens. Red volume bars indicated selling pressure, while green bars matched bullish momentum. This volume-price alignment confirms that traders actively responded to technical levels throughout the day.
Indicators Signal Mixed Sentiment
Technical indicators reveal conflicting signals. The MACD shows bearish divergence with the signal line at -0.0185 and the MACD line at -0.0080. The negative histogram reflects weakening momentum after the morning rally. Additionally, RSI reads 38.53, leaning slightly bearish but not oversold. Hence, traders still see room for further downside before recovery attempts.
Besides, XPL remains within a downward trending channel following its second peak. Price action now consolidates above $1.40 support, offering a cushion despite recent declines. However, lower highs highlight ongoing selling pressure and warn of potential continuation.