
- Fib retracement zones shape long-term market movement and possible breakout while PEPE maintains support levels.
- On the 4-hour chart, a symmetrical triangle pattern indicates consolidation, with moving averages serving as resistance before a breakthrough.
- While traders wait for confirmation of the upcoming trend, the Stochastic RSI shows oversold circumstances.
PEPE is currently testing a key support level as market dynamics suggest a potential retest. Price action indicates that the support line remains intact, offering a crucial point of breakthrough.
Fibonacci Levels Define Long-Term Market Structure
Ali Charts examined the three-day time frame of PEPE, emphasizing how the price interacted with the Fibonacci retracement levels. Before a pullback, the price first spiked to 0.000002489. A period of consolidation ensued after a loss that tested the 0.382 Fibonacci level at 0.000001321.
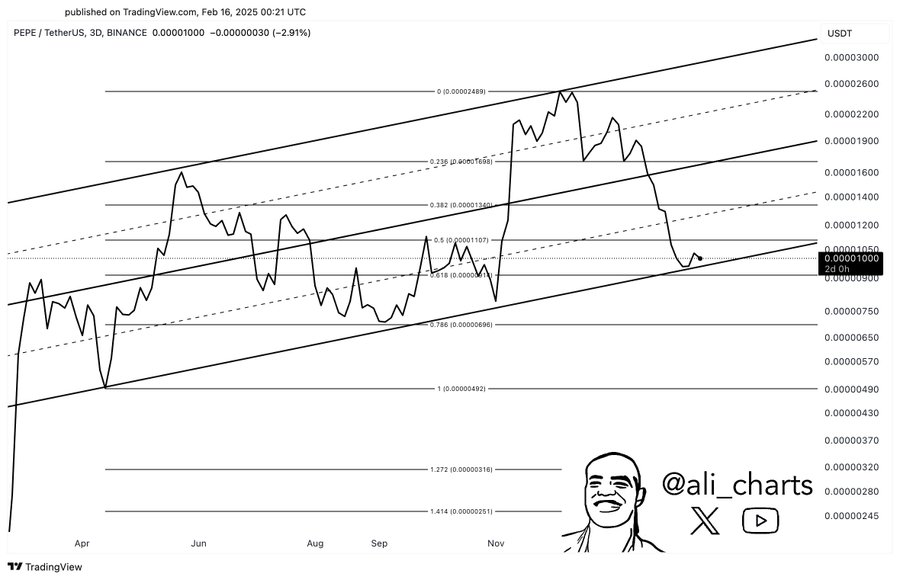
The price maintained an upward channel shape as it moved between Fibonacci levels. PEPE saw another drop, hitting the 0.618 retracement level at 0.000001010, after which there was a small rebound. Resistance at the 0.5 Fibonacci level near 0.000001107 stopped further upward momentum, causing a further decline toward lower support.
As of right now, price activity stays inside the channel while adhering to trendline bounds. An extended rise over the mid-channel trendline would validate additional optimistic sentiment. A break below the lower trendline would indicate a more significant drop in the direction of Fibonacci extension zones.
Short-Term Pattern Signals Consolidation Phase
CryptoLax examined PEPE’s 4-hour time frame, identifying a symmetrical triangle pattern. The price is moving in the direction of a possible breakout point after forming lower highs and higher lows. With the 100-period MA at 0.000001077 and the 200-period MA at 0.000001261, moving averages offer extra resistance.
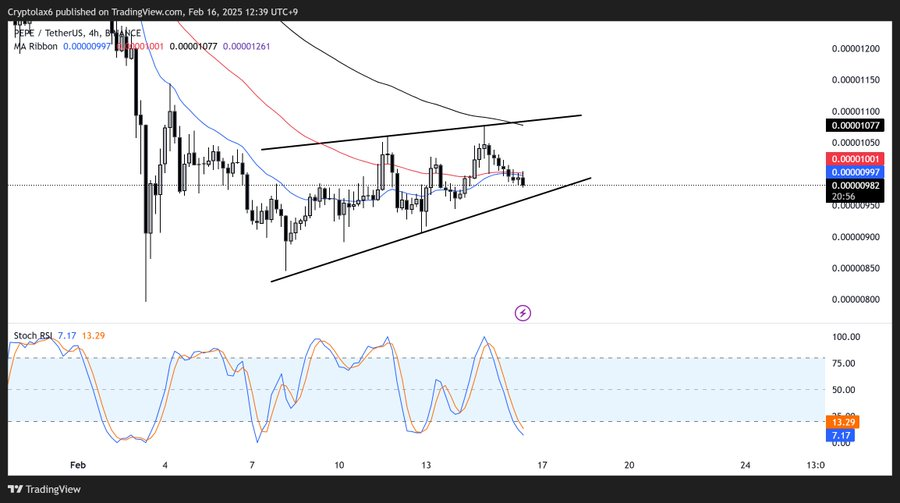
The upper trendline was recently tested and failed, resulting in a rejection close to 0.000001100. The price now trades at 0.000001001 after retracing into rising support. With levels at 7.17 and 13.29, the stochastic RSI suggests oversold circumstances and a possible change in momentum.
If the price sustains its position within the triangle, consolidation may continue until a decisive breakout occurs. Resistance remains above current levels, while the ascending trendline serves as critical support. The market structure suggests a potential breakout, with both bullish and bearish scenarios dependent on price reactions at key trendlines.