
- PEPE shows signs of a major rebound as oversold indicators and bullish chart patterns hint at a possible turnaround.
- Analyst Davie Satoshi expects PEPE to enter wave 3 soon, predicting a 2–3x rise once confirmation signals appear.
- With strong support and steady trading activity, PEPE’s chart structure reflects a healthy setup for its next potential breakout.
Momentum around meme token PEPE is heating up once again after a key technical setup caught traders’ attention. According to analyst Davie Satoshi on X, the token is showing early signs of a potential turnaround on its weekly chart.
As shown on DEXTools, PEPE trades at $0.00006644, recording a 1.05% 24-hour gain. The price continues to move within a broad descending channel that has shaped its performance since mid-2025, indicating a well-defined correction phase following earlier highs near $0.00002824.
The weekly chart displays critical indicators hinting at a potential reversal zone. The stochastic RSI, currently around 2.77 and 2.88, signals an oversold condition, a region where past rallies often began.
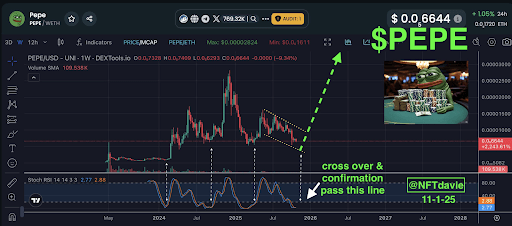
“When there is a crossover at the bottom and a confirmation, we have always seen large green god candles,” said Davie Satoshi. He noted three previous instances when this setup preceded strong impulsive waves, each marking a key turning point in PEPE’s price history.
Chart Patterns Point Toward Recovery Setup
Moreover, the DEXTools data shows steady trading activity with a volume of 109.538K, reflecting moderate market engagement compared to earlier surges. The consistent red candlesticks confirm ongoing selling pressure, yet the stability in trading volume indicates underlying investor interest. A green dashed arrow projected upward marks the possible recovery path once confirmation occurs, aligning with prior rebounds seen in early 2024 and mid-2025.
Additionally, the annotated RSI threshold labeled “cross over and confirmation pass this line” outlines the signal traders are watching closely. When the blue line crosses above the red and rises past this level, previous cycles have delivered explosive upward moves. The support line, yet to be touched, defines the final confirmation area before momentum shifts.
Hence, the overall chart structure reflects a familiar pattern of cyclical bottoming and recovery. The current level still shows over 2,243% gains from PEPE’s earliest price points, proving its resilience through volatile periods. The descending channel, drawn with yellow dotted lines, defines short-term resistance and support while showing PEPE’s consolidation path.