
- Onyxcoin breaks free from a two-year downtrend and eyes a 1,117% move as it consolidates above key breakout support.
- XCN forms a rounded bottom and higher lows near $0.012, signaling bullish accumulation after a steep rally in early 2025.
- With prices holding above resistance, Onyxcoin positions for a major expansion phase targeting $0.1816 and possibly $0.218.
According to Javon Marks, Onyxcoin (XCN) is still above its breakout zone, suggesting that its upward momentum may continue. The price is currently recovering from the protracted decline that began in mid-2022, hovering at $0.01180000. Strong investor interest is seen by XCN’s more than 320% increase from its historical low of $0.00280000. The anticipated upside is more than 1,117%, with a long-term objective of $0.18160000.

Multi-Year Decline Followed by Breakout
Between May 2022 and late 2023, XCN experienced a steady decline. Prices repeatedly formed lower highs, confirming consistent bearish pressure. Besides, the asset maintained a downward trajectory, only pausing during brief consolidation periods. By late 2023, it reached a bottom near $0.00280000.
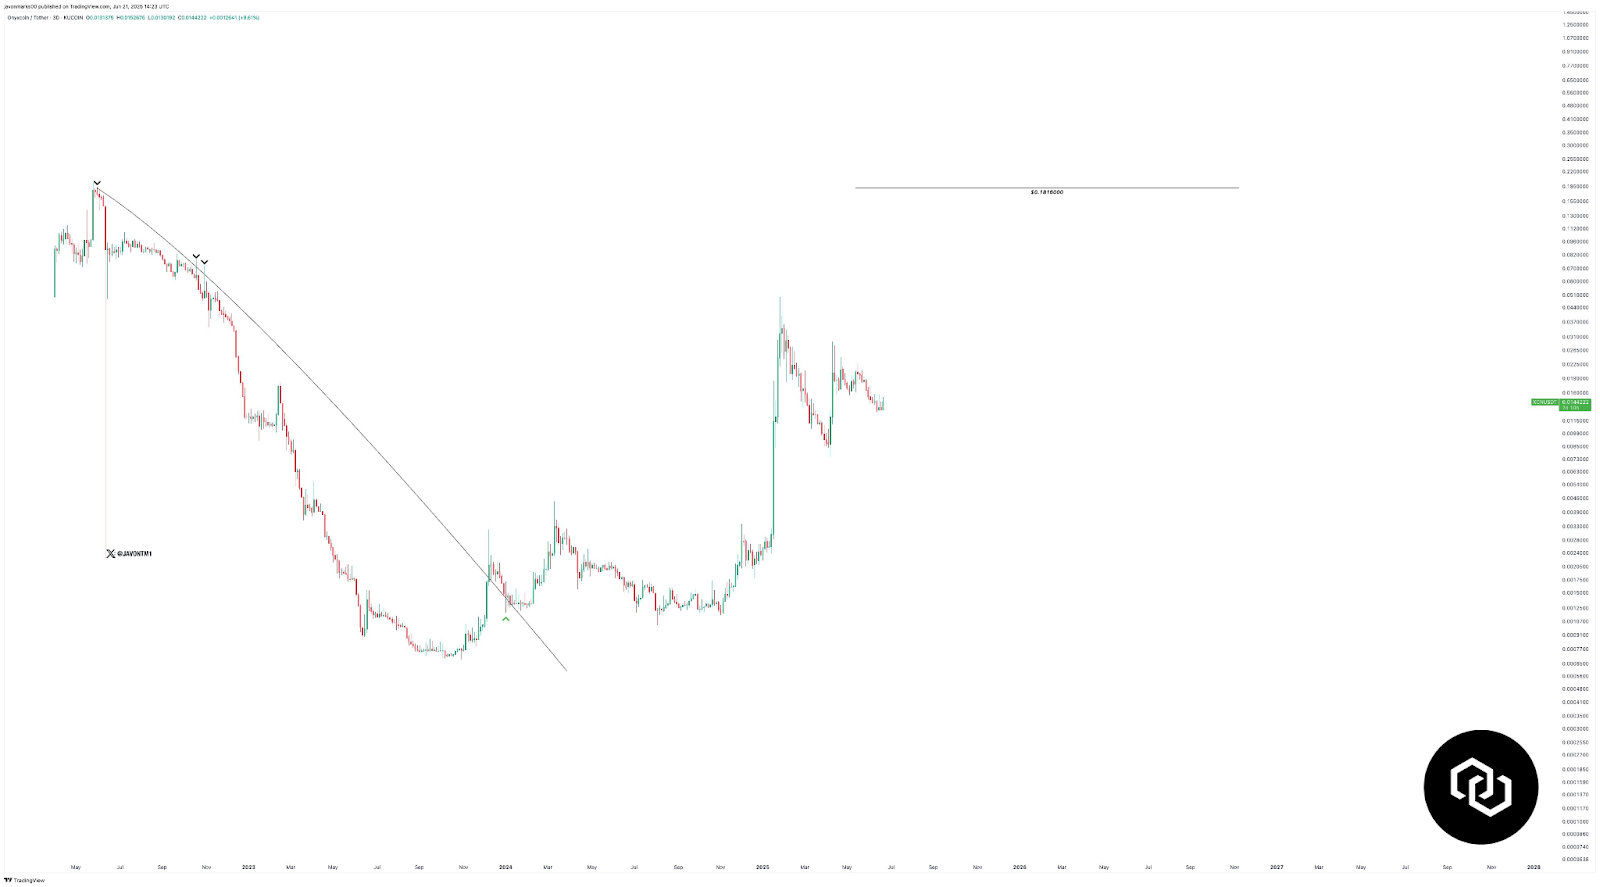
Source: Javon Marks
In early 2024, the trend reversed sharply. XCN broke above its macro descending resistance line, ending the multi-month decline. Consequently, this breakout triggered a strong rally, pushing prices above $0.01500000 by early 2025. This marked the asset’s most significant upward movement since its prolonged drop.
Stabilization and Accumulation Phase
After peaking, Onyxcoin entered a correction phase. Prices retreated but held above previous resistance zones. It stabilized near $0.01200000 while forming higher lows. This pattern indicates that buyers are actively accumulating. Moreover, the rounded bottom structure adds strength to the bullish setup.
Additionally, annotations mark reversal points and trendline interactions. A long horizontal line points toward $0.21800000, marking a potential future resistance level. Hence, traders are closely watching this level for any long-term breakouts.
The current chart structure shows a shift from bearish to neutral and possibly bullish sentiment. The price has not revisited former lows since breaking out. Moreover, the trajectory resembles a transition from accumulation to expansion. This pattern aligns with technical expectations of a strong leg upward.