
- ONDO’s descending wedge pattern suggests an imminent breakout, with price compression hinting at a decisive move.
- The Trump-linked WLFI partnership could boost ONDO’s visibility and impact investor sentiment in the crypto market.
- A breakout above 1.50 USDT may trigger bullish momentum, while failure risks testing support near 1.20 USDT.
Ondo Finance (ONDO) recently announced its partnership with Trump’s company, World Liberty Financial (WLFI). This collaboration marks a significant milestone for the project. ONDO’s latest chart on the Bybit exchange displays a key technical pattern. The ONDO/USDT trading pair is forming a descending wedge, suggesting a potential breakout in the near future. This news, combined with the pattern, could lead to exciting price movements.
Chart Analysis and Market Behavior
The ONDO/USDT on a daily timeframe shows a descending wedge formation. The upper trendline connects lower highs, while the lower trendline links lower lows. These converging trendlines indicate a tightening price range, often signaling a breakout.
Additionally, the price action reveals a correction phase, followed by consolidation. ONDO reached a peak in late 2024 before entering this phase. Currently, the price stands at 1.3966 USDT, reflecting a 5.02% daily increase.
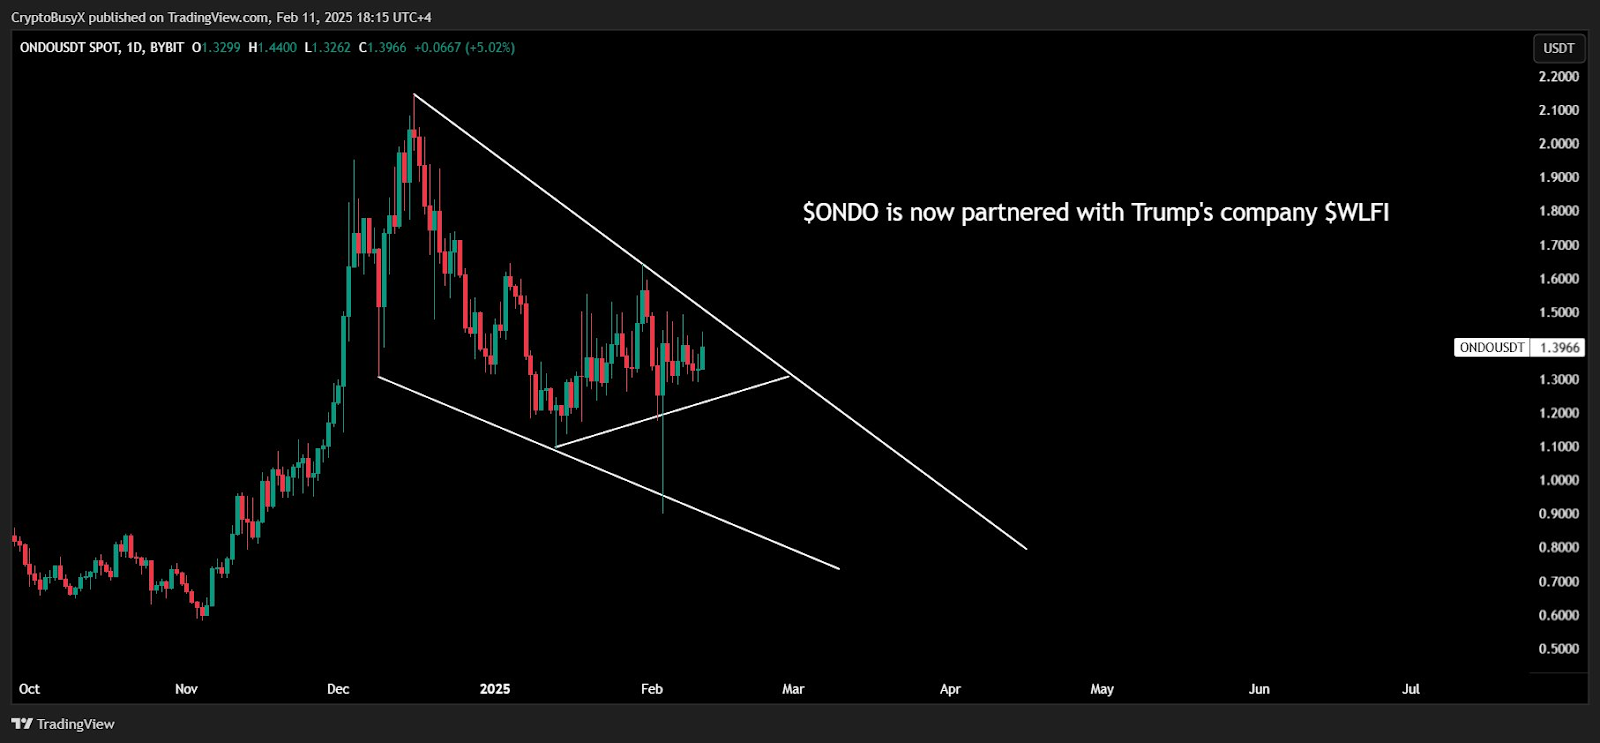
There have been several failed attempts to break through resistance. Despite these challenges, the price has maintained support levels. This suggests the market is uncertain about the next direction. However, the price compression within the wedge indicates that a decisive move may be imminent.
Fundamental Impact: Trump’s Partnership
Moreover, ONDO’s recent partnership with Trump’s WLFI introduces a fundamental shift. This collaboration is likely to attract investor attention. The connection to real-world assets (RWA) is a clear signal that ONDO is focusing on long-term growth. Hence, market sentiment could shift depending on how investors perceive the strategic partnership. As this unfolds, ONDO’s price action may experience increased volatility.
The data reveals that a breakout or breakdown from the wedge pattern could bring substantial price movement. If buyers gain momentum, resistance above 1.50 USDT becomes a critical target. However, a breakdown may test support levels below 1.20 USDT. The narrowing price range suggests that the market is awaiting a significant shift in direction.