- NEO holds strong support at $6.30–$6.50, keeping the bullish setup alive.
- Price trades near $6.72, with a breakout above $7 opening doors to $7.50–$8.00.
- Volume is low, showing traders are cautious; more buying needed to push higher.
NEO trades at $6.73 with a slight dip today, but the bigger picture looks promising. Holding firm above key support, buyers are stepping up. A breakout past resistance at $7 could be just around the corner if volume rises.

NEO Holds Key Support, Eyes Possible Breakout
NEO is above important support levels on the daily chart. The price is above both the rising trendline and the $6.30–$6.50 support zone at $6.73 .This support area aligns with the 50-day Simple Moving Average (SMA) at 6.516 and the 9-day Exponential Moving Average (EMA) at 6.669.
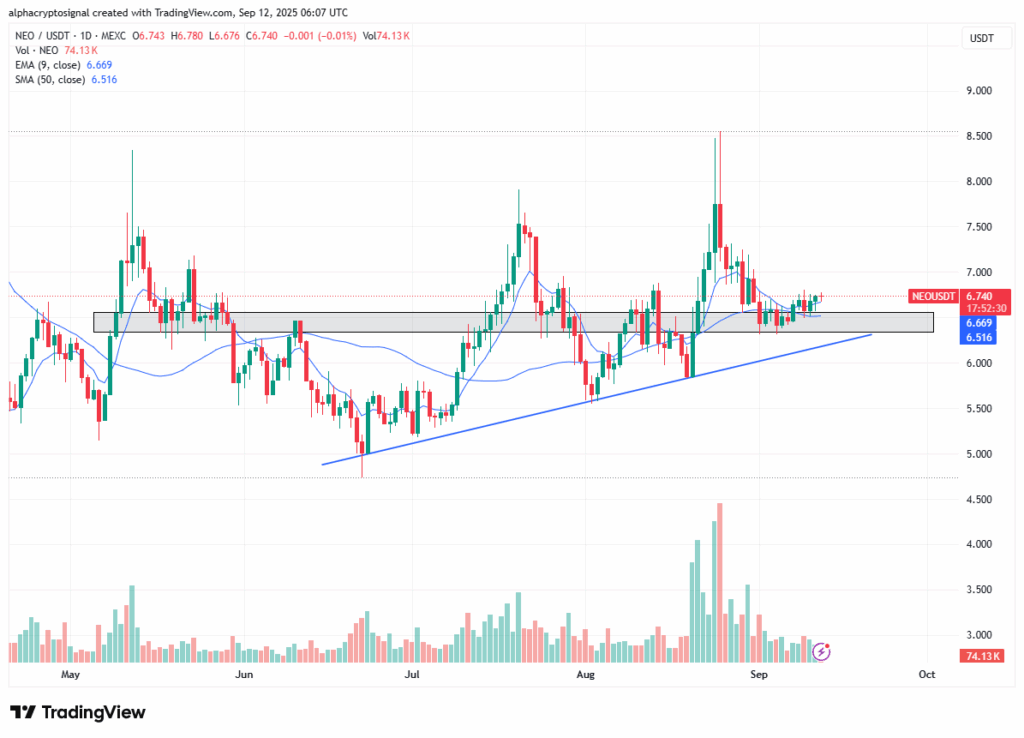
This zone is a solid base where buyers have stepped in multiple times and defended the prices from going down.NEO is currently testing resistance near $6.80 to $7.00. A strong close above $7 with good volume, could push the price up toward $7.50 or even $8.00.
The charts are forming a bullish ascending triangle pattern.However, volume has dropped, suggesting that traders are waiting for a clear signal before jumping in.
Volume Drops, But Moving Averages Show Mild Bullish Signs
Volume has decreased compared to the strong buying seen in late August and early September showing a cautious approach.The 9-day EMA is just above the 50-day SMA. This is a bullish sign, but the momentum is still weak.
Moving averages show that the market is ready for a move, but it needs more volume to confirm a breakout. If volume picks up and the price breaks above resistance, NEO could see a good rally.
On the other hand, if the price drops below $6.50,the price could fall toward $6.00 or lower.
Short-Term Indicators Point to Uncertainty
Short-term indicators are mixed. The MACD recently showed a bearish crossover, indicating some selling pressure which looks mild and may not last long. The RSI is near 38, close to oversold territory,suggesting selling might slow down soon.
This hints that the recent dip could be ending and a bounce might happen. Traders should watch for the MACD to turn bullish or the RSI to improve as early signs of a price rise.