
- NEAR price breakout follows weeks of descending channel compression and seller exhaustion on the 4-hour chart.
- Network activity trends show NEAR maintaining user engagement despite heavy token price drawdowns.
- A sharp market cap recovery confirms renewed demand after several days of consolidation below resistance.
NEAR price breakout has drawn attention after a decisive technical move, supported by improving market structure and stable on-chain activity. Recent charts and market data suggest buyers are regaining control following an extended downtrend.
Technical Structure Shows Controlled Breakout Formation
NEAR price breakout emerged from a well-defined descending channel on the four-hour NEAR/USDT chart shared by ZAYK Charts. Price action respected downward resistance and support for several weeks, signaling structured bearish control rather than erratic volatility.
As the range narrowed, momentum weakened near the channel base. Repeated defenses of support indicated fading selling pressure, while candles began showing stronger closes. This behavior reflected growing buyer presence rather than sudden speculative interest.
The breakout occurred near the lower-right channel boundary, where price pushed above recent lower highs. According to the chart commentary, this shift marked a transition from distribution toward early accumulation. The former channel resistance now stands as a key retest area.
ZAYK Charts noted that holding above this level would support continuation toward the projected recovery zone near the psychological $2.00 area. Failure, however, would suggest renewed range-bound behavior instead of trend development.
Network Activity Data Adds Context to Price Action
While price remains far below historical highs, network usage paints a different picture. NEAR’s valuation relative to its on-chain engagement. NEAR trades about 92.5% below its peak, yet monthly active addresses show limited decline.
Solana leads in volume but shows sharper fluctuations, reflecting more volatile user behavior. NEAR’s steadier profile suggests consistent retention rather than speculative bursts.
BNB Chain displayed a gradual rise in activity, while Ethereum remained stable but comparatively smaller in transactional volume. Tron and Tether maintained consistent usage, largely driven by utility transfers rather than application growth.
Market Capitalization Confirms Renewed Buying Pressure
Market cap moved sideways with a mild upward bias, a behavior that suggested accumulation rather than aggressive positioning. A brief rally toward the $2.1 billion zone followed, before sellers’ profit-taking quickly capped gains.
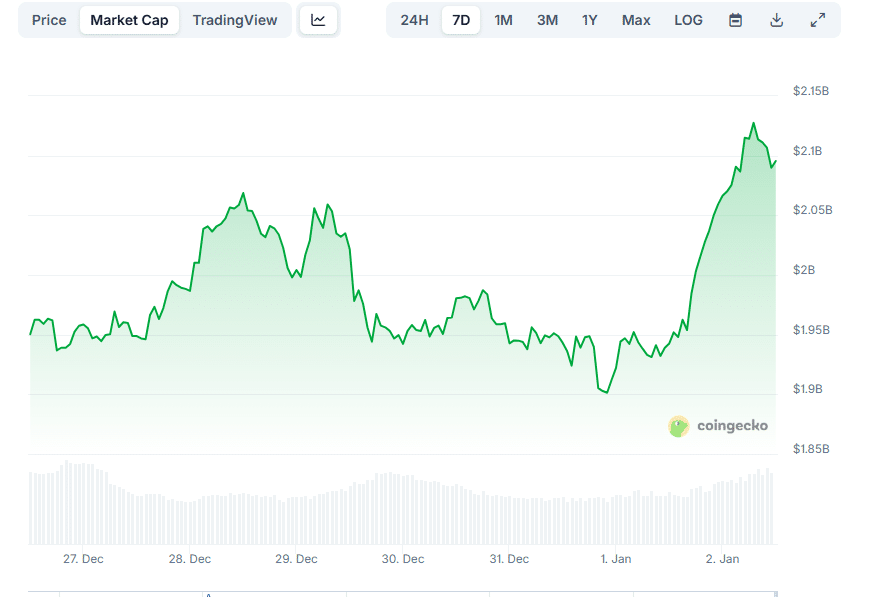
This consolidation phase reflected balance between buyers and sellers, with neither side asserting dominance. A dip near $1.9 billion tested demand but failed to break support.
The strongest signal arrived on January 2, when the market cap surged sharply and exceeded prior highs. The move reclaimed lost ground rapidly, indicating renewed buyer confidence rather than thin liquidity movement.
The NEAR price breakout aligns with this expansion, reinforcing the view that technical structure, user activity, and capital flows are moving in the same direction for now.