
- NEAR open interest fell 22% before Bitwise’s NRR ETF launched, declining from 215 million to 169 million NEAR.
- Open interest later rose 4% as NEAR fell 10% on October 1 following the exploit disclosure.
- NEAR traded below its $4.98 50-day moving average, with $4.39 and $3.85 identified as key support levels.
NEAR Protocol recorded two major developments within three days as Bitwise’s NRR ETF launched and NEAR Intents disclosed a $3.8 million exploit. Santiment Intelligence reported that open interest declined approximately 22% before the ETF launch. However, derivatives traders increased positions as NEAR’s price dropped on October 1.
ETF Launch Coincides With Lower Open Interest
Bitwise’s NRR ETF began trading on September 29, attracting approximately $35 million in net inflows on its first day, according to the firm. Ahead of the launch, NEAR open interest measured in coins declined from 215 million on September 21 to 169 million on September 30.
This represented a decrease of approximately 22% as NEAR’s price climbed toward the ETF debut. Santiment reported that the reduction reflected lower derivatives exposure, although the data does not identify whether traders held long or short positions.
NEAR’s price remained approximately 12% higher than its September 21 level, despite the subsequent decline.
Exploit Disclosure Triggers Derivatives Activity
On October 1, NEAR Intents disclosed a $3.8 million exploit and said the issue had been patched. The project also stated that affected users would receive full compensation. NEAR closed at $4.81 that day, recording an approximately 10% daily decline.
Meanwhile, open interest increased by roughly 4%, rising from 169 million to 176 million NEAR. Santiment noted that traders added positions during the price decline. However, the available open interest data does not distinguish between bullish and bearish exposure.
NEAR Chart Shows Pullback From September High
The supplied chart places NEAR near $4.69, below its recent peak of approximately 5.40–5.45. The price had broken above $2.78 and $3.85 during September’s rally, before advancing through $4.39.
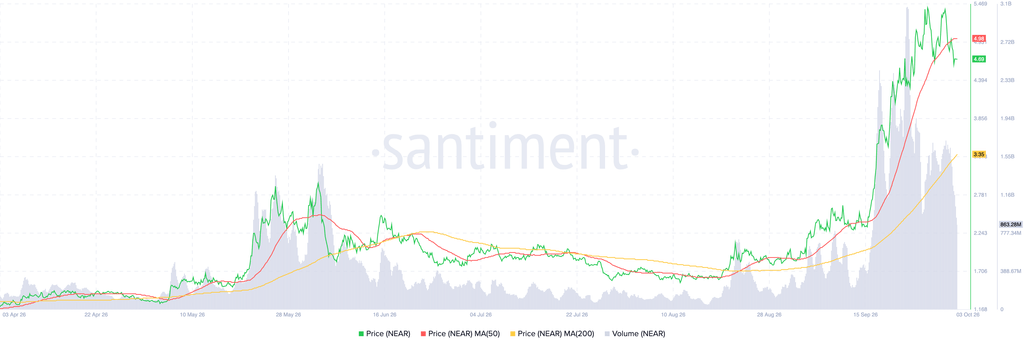
The $4.39 area now represents near-term support, followed by $3.85 and $3.35. Meanwhile, the 50-day moving average stands at $4.98, above the current chart price, while the 200-day average sits at $3.35.
Volume expanded during the September breakout, reaching approximately 863.28 million NEAR. A move above $4.98 could bring the recent high back into focus, while a drop below $4.39 exposes lower support levels.