- Monero $XMR faces major resistance at $470 where higher lows have been forming for two years, indicating strong accumulation trend.
- Intraday price shows U-shaped recovery,reflecting growing buyer interest and market confidence.
- Intraday market capitalization rose from $7.1B to $7.7B signaling synchronized demand as Monero retested long-standing resistance.
Monero $XMR is testing a long-standing resistance level around $470. This zone has been a ceiling that has held since 2018. The crypto is showing steady accumulation and improved price structure around this critical zone. Analysts are closely monitoring market activity for potential breakout signals.
Historical Resistance and Market Cycles
$470 is XMRs critical that has been tested on multiple occasions with the most notable in 2018 and 2021.Both rejections led to extended consolidation due to downward pressure over the next several years. The first rejection was followed by a bull market, resulting in a prolonged downtrend that lasted for years.
In the 2021 attempt a strong rally occured but buyers could not surpass the resistance, leading to an extended sideways movement through 2022–2024. Each rejection emphasized the structural importance of the $470 level across multiple market cycles.

Current price action shows a two-year accumulation period with higher lows forming consistently. This gradual build reflects increasing demand and structural stability as XMR prepares to retest this key resistance.
Intraday Price Dynamics
On the intraday chart, Monero traded between approximately $385 and $420, forming a U-shaped recovery. The price fell to around $387–$390, then gradually moved higher with rising lows during mid-session.
Later, the price held above $395 and eventually rose from $405 to over $415, showing stronger buying and approaching the multi-year resistance level.
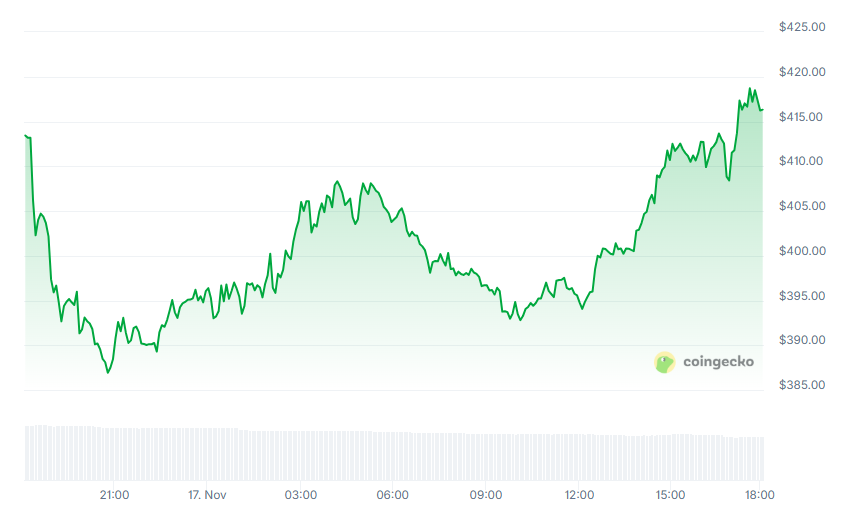
This intraday movement indicates accumulation and growing confidence among market participants. The closing strength at session highs signals potential for further upward moves if the resistance is broken.
Market Capitalization Trends
Monero’s market cap moved between $7.1B and $7.7B over 24 hours. Early in the session, it dropped from above $7.6B to around $7.1B–$7.2B due to selling.
The market cap later recovered and stayed between $7.3B and $7.5B, showing steady buying. In the final hours, it rose back above $7.6B, following the price movement.
CoinGecko charts show that market cap and price trends are moving in tandem. The combination of higher lows and rising final session activity supports the ongoing test of the historical $470 resistance level.