
- Memecoin surged by 82% after a falling wedge breakout, with projections suggesting a potential run toward $0.018.
- MACD bullish divergence and rising momentum support the token’s ongoing recovery after a prolonged multi-year downtrend.
- Current support at $0.002200 is crucial for sustaining momentum, with upside targets between $0.005000 and $0.006000.
Memecoin has seen a change in momentum following an extended downtrend that began in mid 2021. Recent price action shows that the token, after months of steady decline, has managed to break out of a falling wedge pattern, a structure often linked with reversals.

Since the latest update, the asset has climbed nearly 82%, confirming early strength. Analysts tracking the move note that if momentum continues, the next projection could stretch to $0.018, marking a possible 333% gain from recent levels.
Trend Reversal Highlights
The left side of the chart indicates a parabolic rise that was quickly followed by a steep decline. This created a wedge, defined by converging downward trendlines with repeated touches at both support and resistance levels.
At the right edge of the formation, prices have started pushing upward, suggesting that sellers may be losing strength. The first notable resistance is near $0.012, while the larger breakout target is at $0.018.
Indicators Backing Momentum
The MACD line has crossed above the signal line, while the histogram now trends positive. Additionally, a bullish divergence has emerged, with the indicator forming higher lows against declining price action.
This points to reduced selling pressure and increasing momentum on the upside. Volume, while not directly shown, is implied to be rising during the wedge breakout phase, further supporting the move.
Market Patterns and Key Levels
World of Charts on X noted how the token transitioned from consistent lower highs earlier in the year to renewed upside. From January through June, MEME fell from $0.012000 to lows near $0.000700.
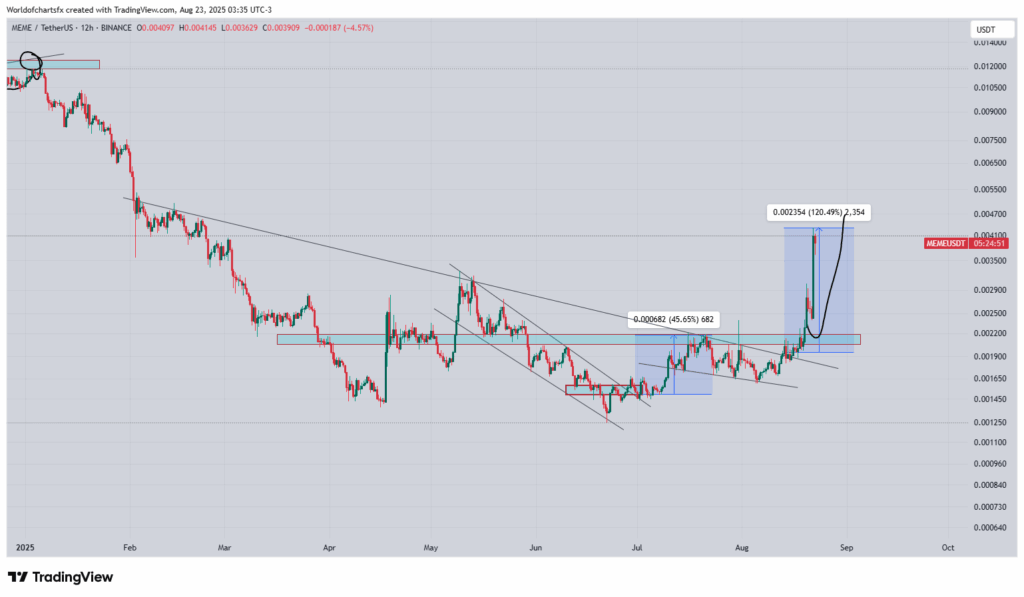
However, in late June, a confirmed breakout above the falling wedge led to a 45.65% rally. The move gained strength in August, when the coin broke resistance at $0.002000 to $0.002200 and surged by 120.49% to $0.004100 before retracing.
At press time, MEME was trading at $0.004078 in consolidation. The $0.002200 zone now acts as a key support level after turning from resistance. Holding this base could allow another attempt toward the $0.005000–$0.006000 area. According to CoinGecko data shared by AXL, the token ranks in the top two across both Trending and Top Gainers categories. Furthermore, World of Charts reported profits of 125% since the recovery phase began, indicating the strong change in market structure.