
- MOVE retraces into Fibonacci support (0.618-0.66), with 20/50 SMAs aligning for a potential bullish rebound.
- Current support at 0.4400-0.4500 USDT; holding above key levels may confirm bullish momentum toward 0.5200-0.5400 USDT.
- Breakout disrupted the downtrend, but low volume raises uncertainty. A move above 0.4942 USDT could reinforce bullish strength.
The cryptocurrency market is experiencing strong movements, with $MOVE showing significant price action. Over the weekend, a massive breakout occurred, pushing the price higher from last Tuesday’s low. Currently, the price is retracing into the golden Fibonacci zone (0.618-0.66 level), signaling potential support.
Furthermore, the 20-period and 50-period moving averages form a cross just below the current price. This cross aligns with a relatively high, adding to the bullish outlook. A bounce from the current level would confirm market strength and set up the next leg upward.
Current Market Performance and Technical Indicators
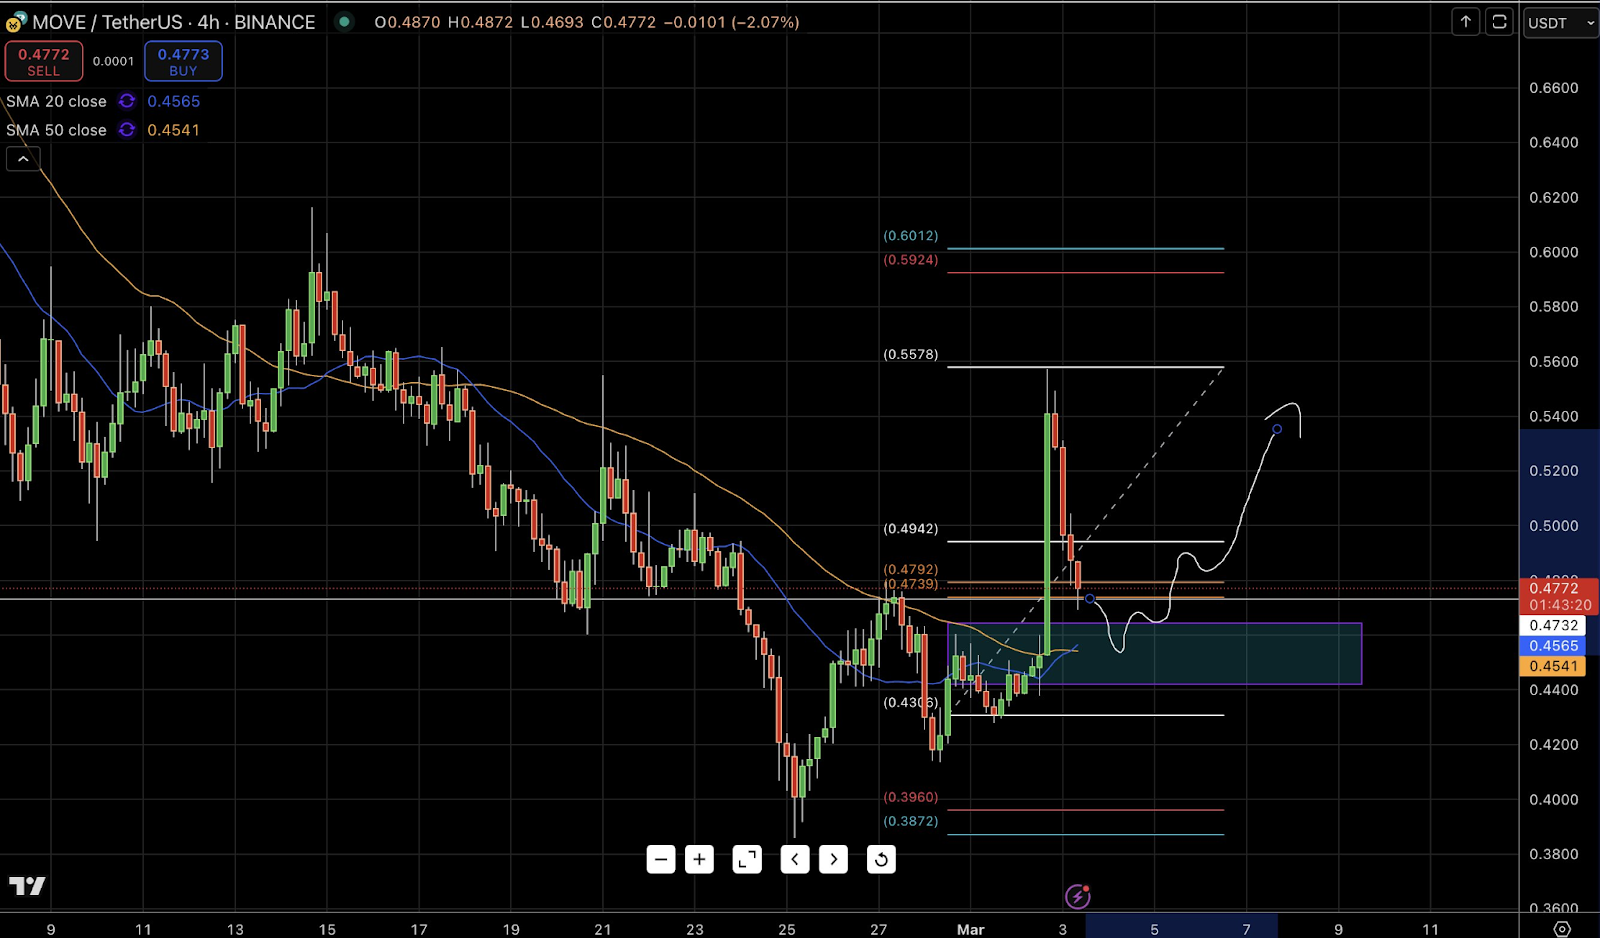
The 4-hour chart for MOVE/USDT on Binance indicates a recent pullback after a sharp price increase. As of right now, the asset is trading at about 0.4772 USDT, down 2.07% from the previous session. The Simple Moving Average (SMA) for 20 periods is at 0.4565 USDT, while the SMA for 50 periods is at 0.4541 USDT.
Notably, the price has recently moved above both SMAs, indicating potential bullish momentum despite the retracement. If the price holds above these moving averages, upward momentum could continue.
Support and Resistance Zones with Fibonacci Levels
Several key levels are in focus. Immediate resistance is seen at 0.5578 USDT, a point the price briefly touched before pulling back. Meanwhile, the support level is at 0.4400 – 0.4500 USDT, where there is buying pressure. The Fibonacci retracement tool gives the important levels at 0.4942 USDT and 0.4792 USDT. The asset is now fluctuating around 0.4739 USDT, where the direction of the next movement will be determined.
Moreover, the projected price movement indicates possible consolidation before another bullish push toward 0.5200–0.5400 USDT. If the price breaks below the demand zone, further downside could follow. Conversely, surpassing 0.4942 USDT may confirm continued bullish momentum.
Previously, with lower highs and lower lows, $MOVE was on a downward trajectory. The most recent surge, however, broke this pattern and raised the possibility of a market downturn or reversal. Strong purchasing pressure is indicated by the long bullish candle, which heightens hopes for additional gains.